Autonomous DEM
Prisma Access Location Details
Table of Contents
Prisma Access Location Details
In the Prisma Access Locations dashboard, List
View tab, click a PA Location Name to
open the Prisma Access Location Details page.
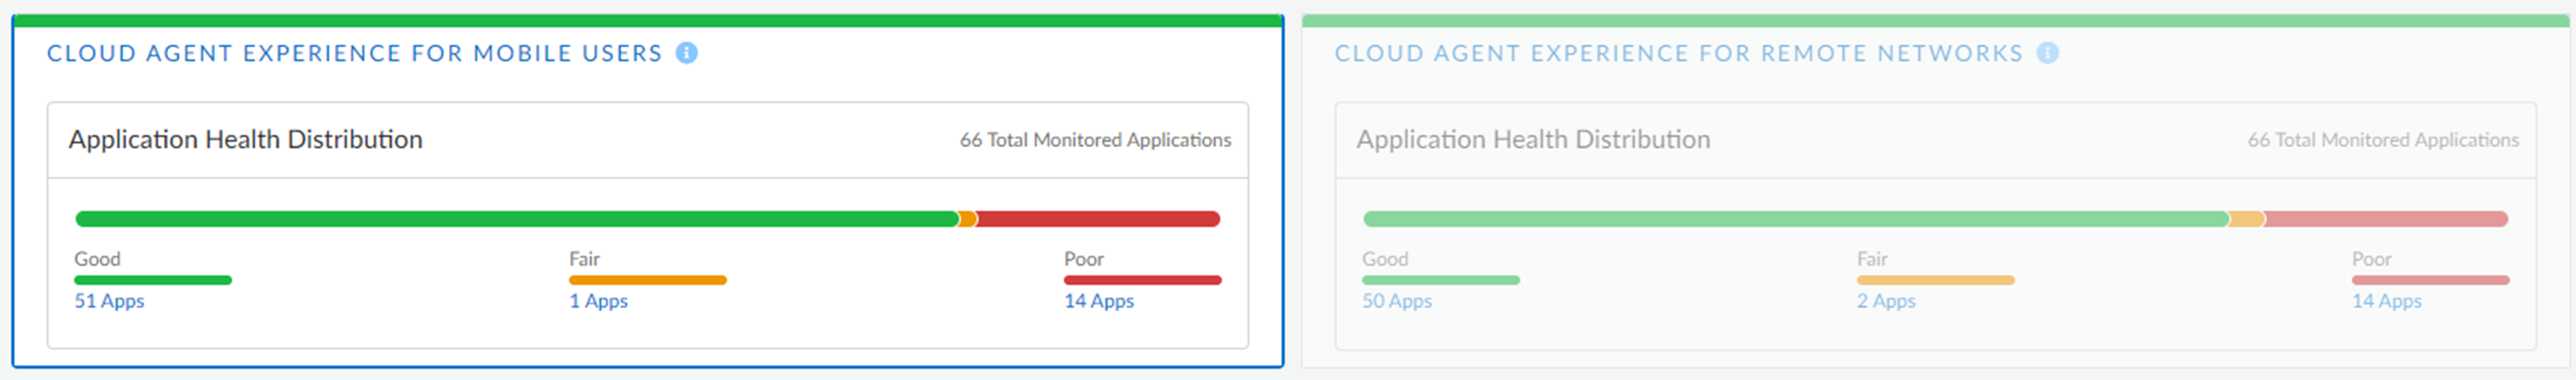
Cloud Agent Experience Cards
View the end-to-end performance metrics from the Prisma Access Location to the
applications. You can see the total number of applications used in a Location, as
well as their health distribution. Click on the deployment type card to see the
metrics for only that deployment type.
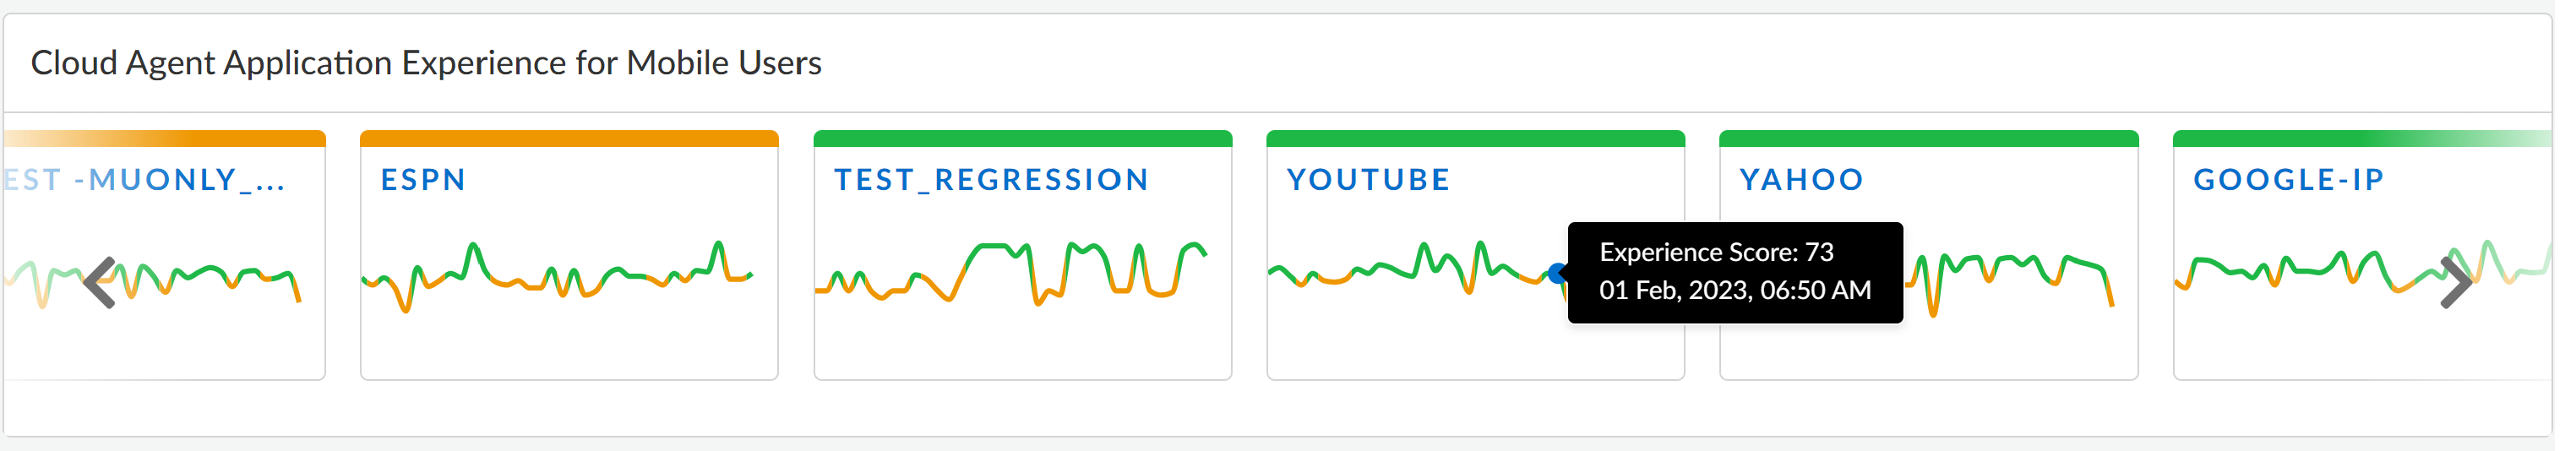
Cloud Agent Application Experience
This widget shows you the status of each application test that is being monitored on
the deployment type that is selected in the Cloud Agent
Experience widget. By default, the left most application test is
selected. Application test tiles are sorted by ascending order from lowest to
highest application score. Click on a card to see the details associated with it in
the widgets below. Besides filtering data by deployment type (by selecting the card
for the deployment type in the top most widget), you have the option to filter
(click
![]() ) the data
using one or more of the following filters:
) the data
using one or more of the following filters:
- Application
- Experience Score
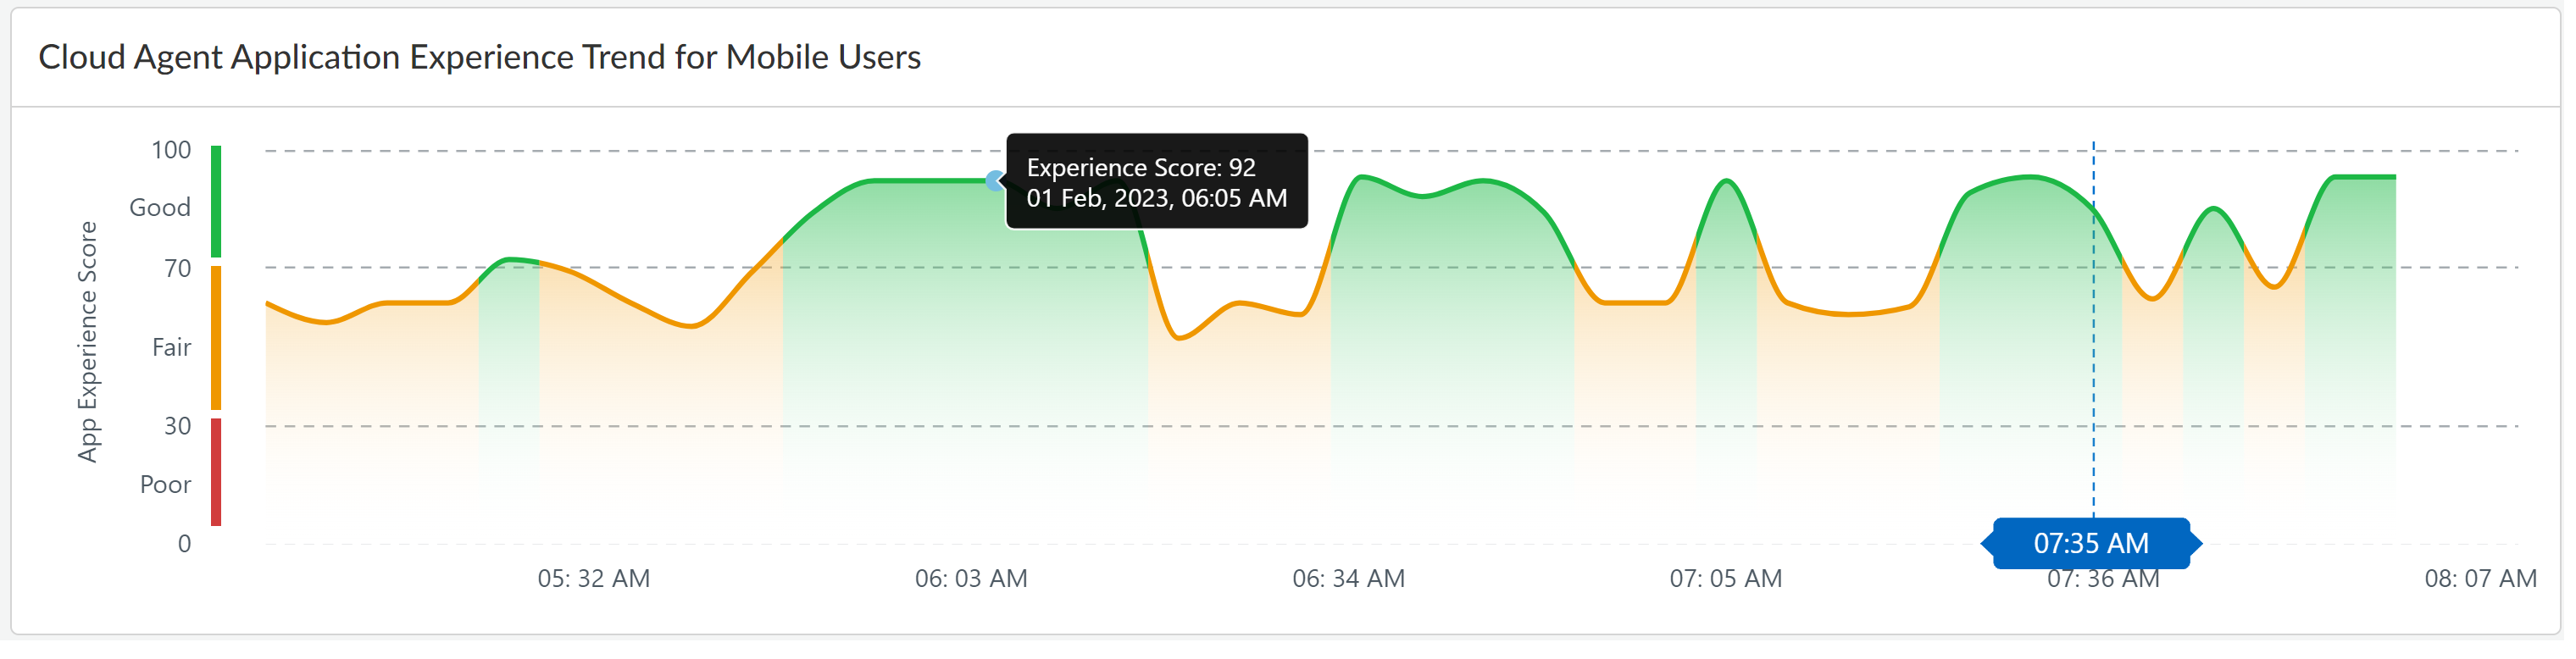
Cloud Agent Application Experience Trend
View the application experience score trend during the selected Time
Range for the application test that is selected in the
Cloud Agent Application Experience widget. Click
anywhere in this widget and drag your mouse if you would like to see data for a
specific time range within the widget.
Cloud Agent App Performance Trend
Application Performance Metrics
This widget shows you the responsiveness and availability for the application running
in the Prisma Access Location. Select the metrics that you would like to see by
selecting their check boxes.
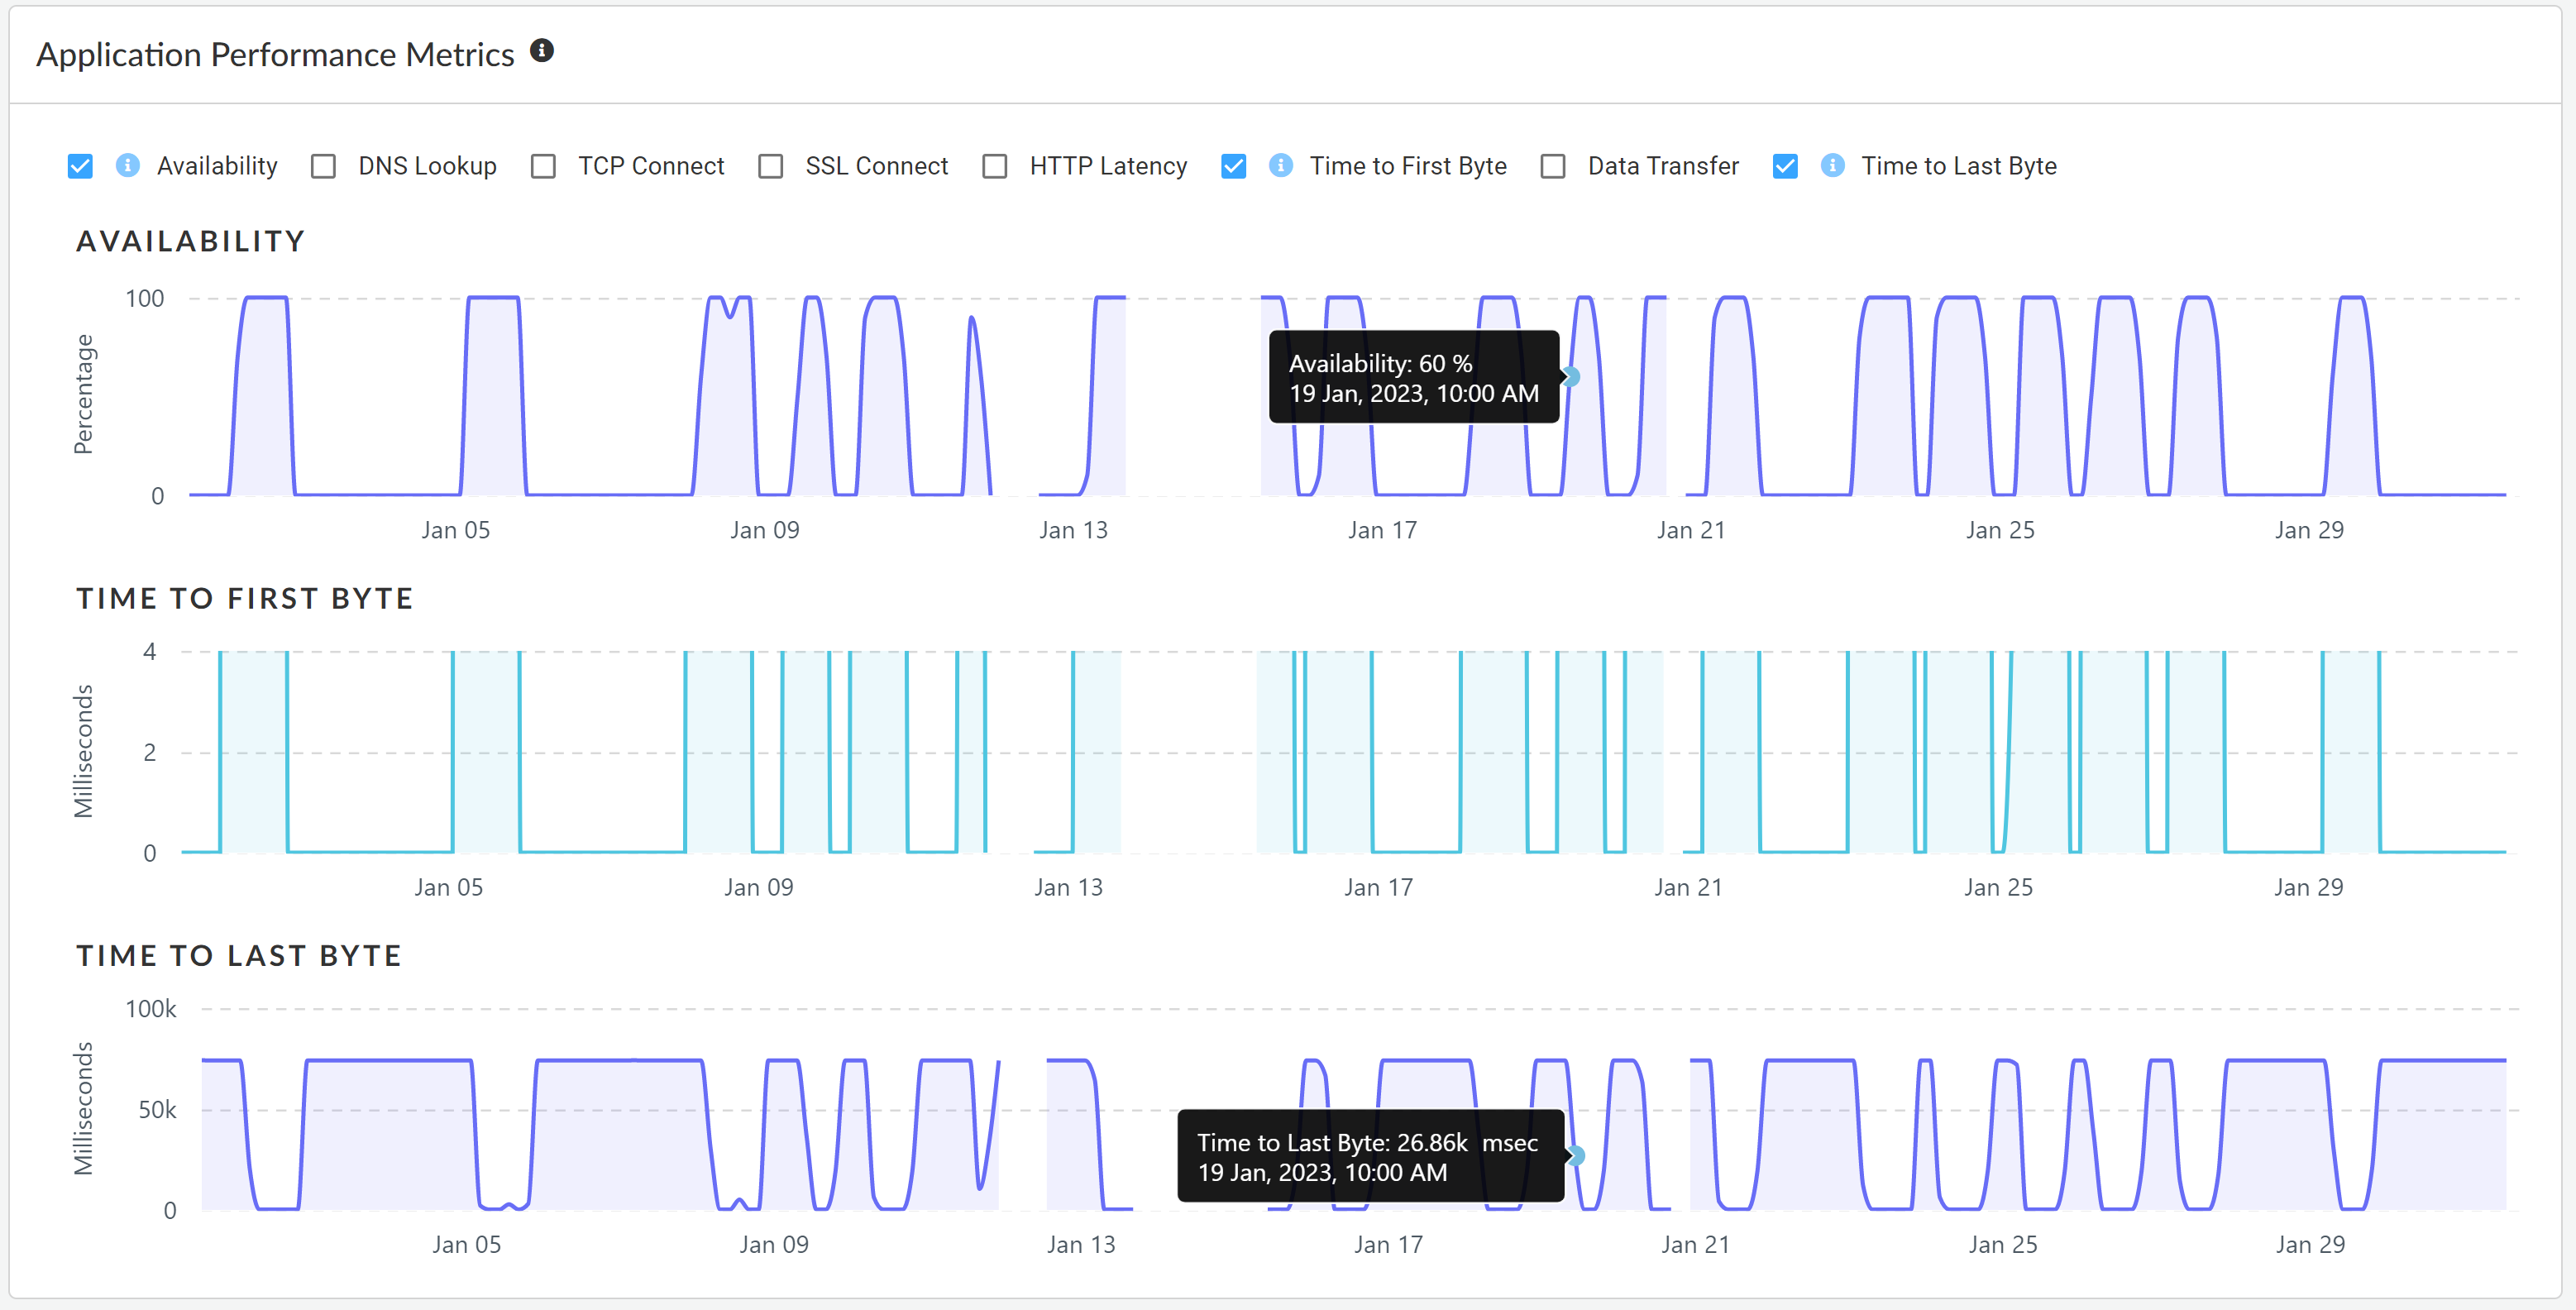
| Metric | Description |
|---|---|
| Availability | Application availability (in percentage) during the Time Range. |
| DNS Lookup | DNS resolution time. |
| TCP Connect | Time taken to establish a TCP connection. |
| SSL Connect | Time taken to establish an SSL connection. |
| HTTP Latency | Time taken to establish an HTTP connection. |
| Time to First Byte | The total of DNS Lookup, TCP Connect, SSL Connect and HTTP Latency time results in the Time to First Byte. |
| Data Transfer | Total time taken for the entire data to be transferred. |
| Time to Last Byte | Time to First Byte + Data Transfer time. |
Network Performance Metrics
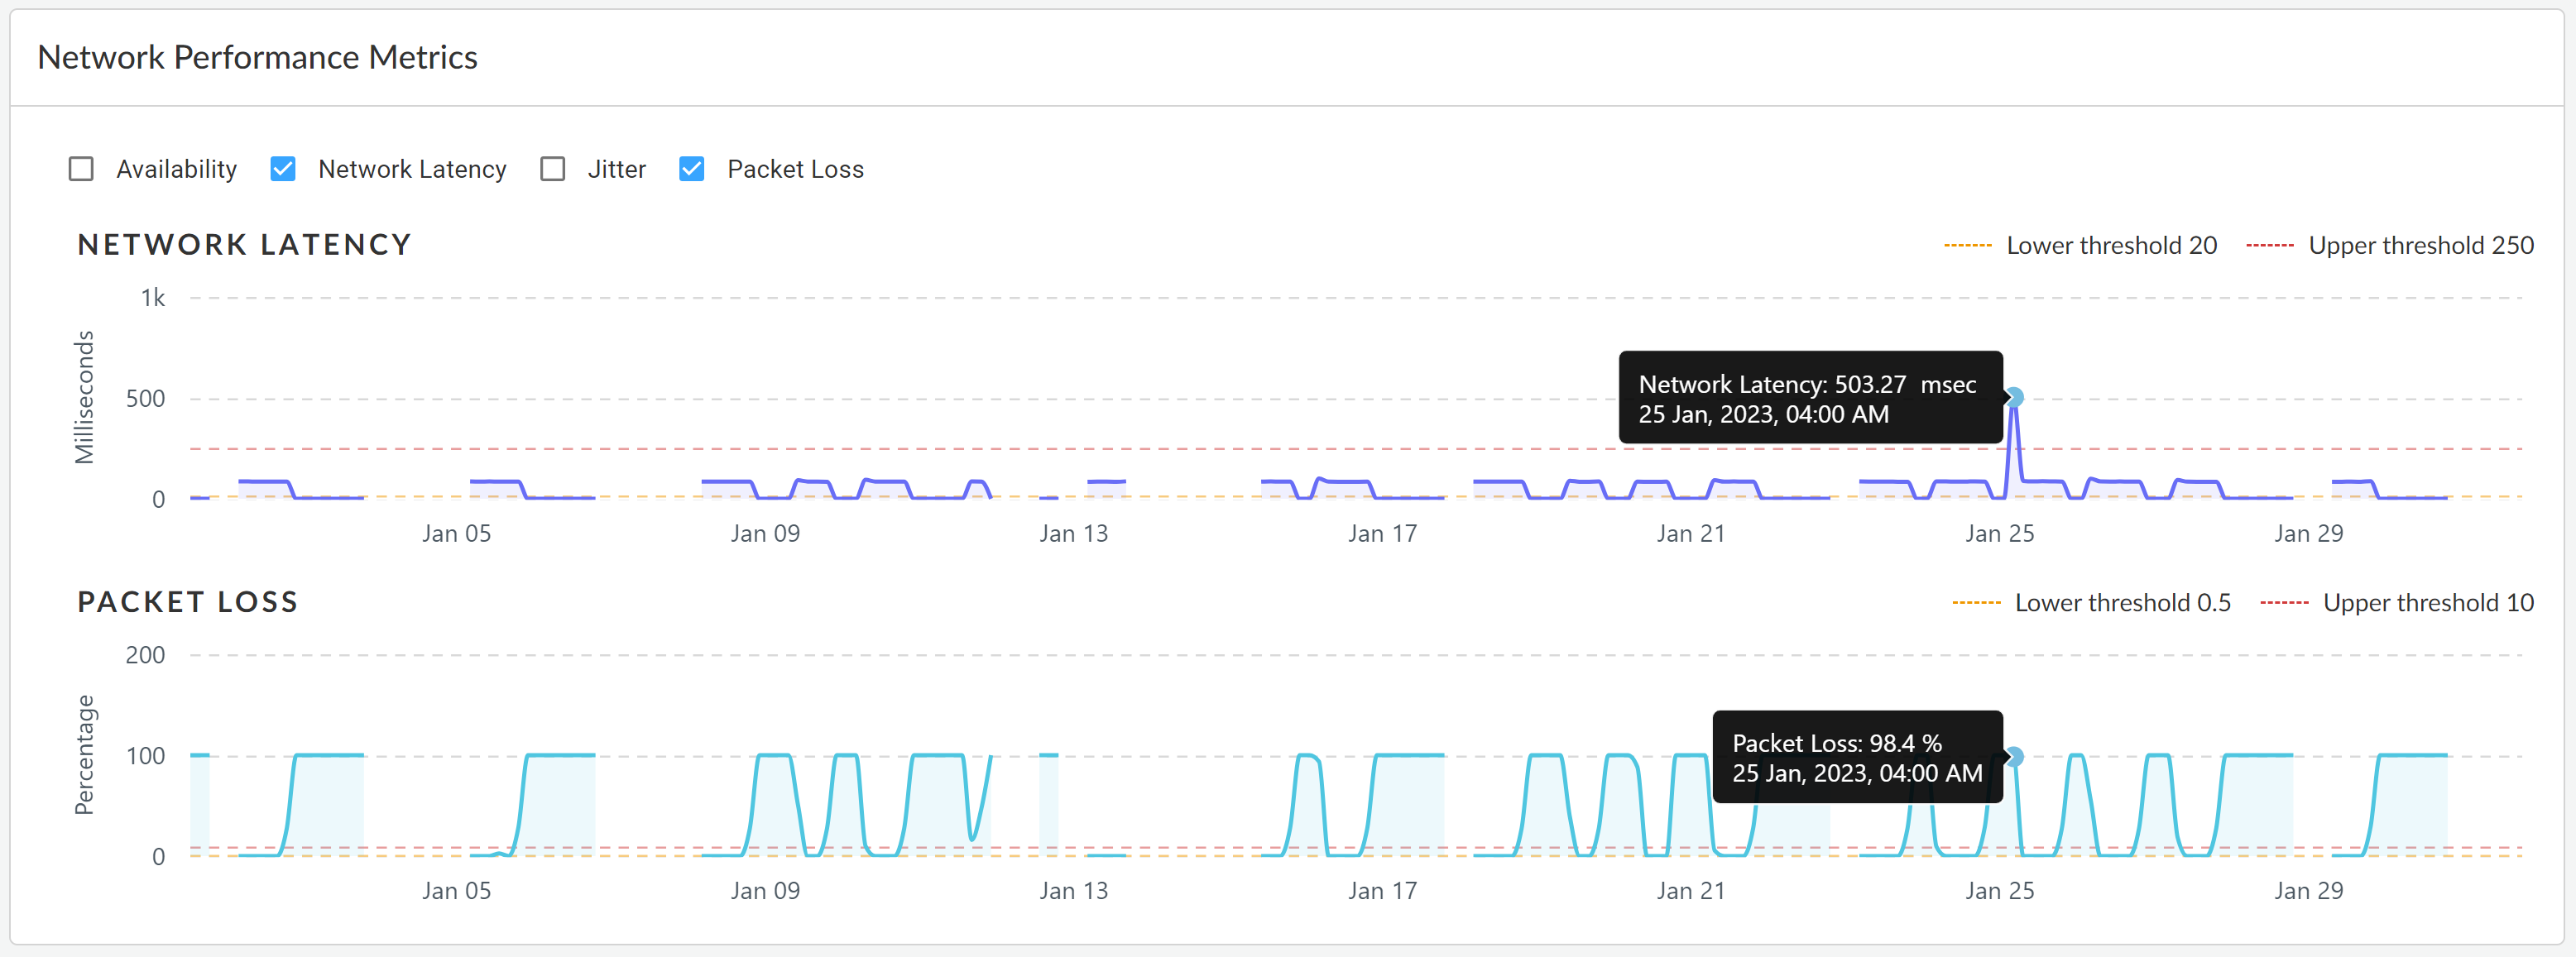
Network Performance Metrics
| Metric | Description |
|---|---|
| Availability | Network availability metrics during the Time Range. |
| Network Latency | Time taken to transfer the data over the network. |
| Packet Loss | Loss of packets during data transmission. |
| Jitter | Change in latency during the Time Range. |
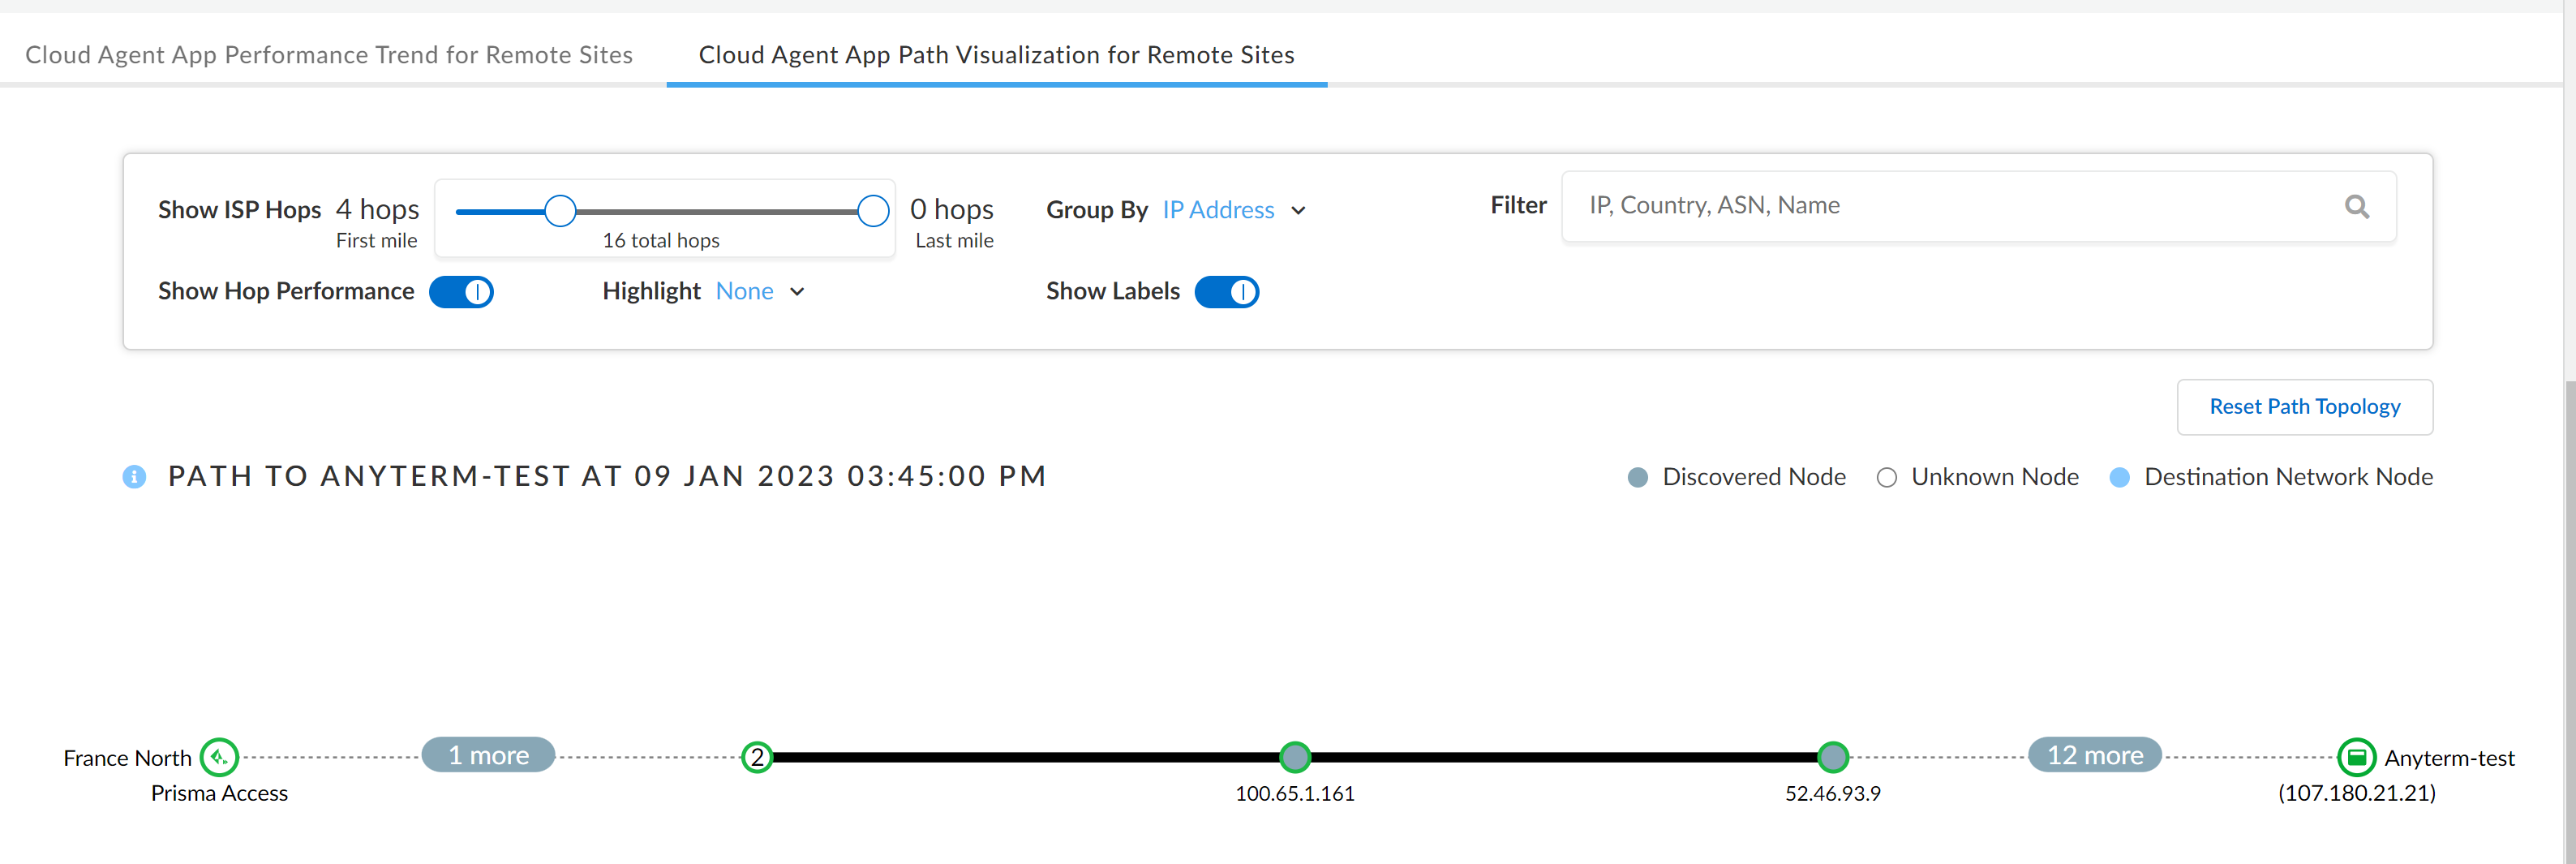
Cloud Agent App Path Visualization
If you selected a time slice in the Cloud Agent Application Experience
Trend widget by clicking and dragging your mouse pointer, this
widget displays the network topology and path visualization for that time slice.