Autonomous DEM
Remote Site Details
Table of Contents
Remote Site Details
In the Monitored Remote Sites dashboard, Monitored
Remote Sites table, click a remote site name to open
the Remote Site Details page.
Remote Site Experience

When you drill down, the experience score for a remote site gives
you an indication if the site is performing good, fair, or poor.
The site experience score is an average score of all monitored applications
on all active WAN paths. It is an average of all test sample results
that are collected from individual applications monitored for that
remote site.
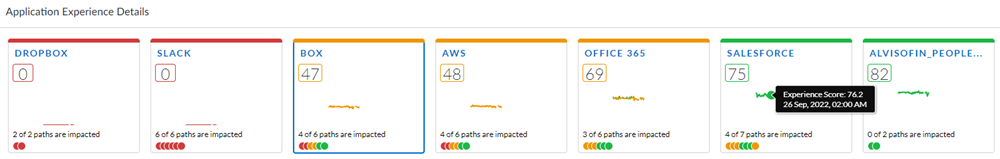
Application Experience Details
View the detailed metrics for each application running
on your remote site.
- Application Cards - Each application card shows you the experience score for the particular application on the remote site. The number enclosed in the square shows the end-to-end experience for the active paths of the application. It is the average of all test samples collected on the active paths for that specific application only. See Calculating Experience Score for Remote Sites for details on how the experience scores are calculated for remote sites.You can see how many applications you are monitoring and also how many active and backup paths are monitored. Each application card shows the number of paths that are impacted. The red or yellow dots in the legend indicate that the path is impacted. Green stands for good.Click an application card to see the metrics for that specific app.
![]()
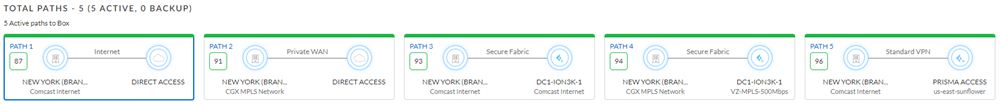
- Total Paths - See the number of active and backup paths that are being monitored for the selected application, the type of paths used. The number enclosed in the square is the experience score for its active path as well as its backup path. See Calculating Experience Score for Remote Sites for details on how the experience scores are calculated for remote sites.For both active and backup paths of an application, ADEM collects the following information, which is different for each type of path:
- Calculates an experience score.
- The types of paths (Prisma Access path (standard VPN), Secure Fabric path, or Direct Access path).
- Its source circuit and destination termination points. Click on a type of path (active or backup) to see the filtered data for that path type only in the widgets that follow.
![]()
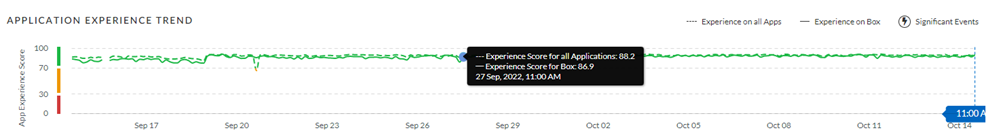
- Application Experience Trend - Hover your mouse cursor on an application trend line in the application card to see the experience scores at any point in time during the given interval.
![]()
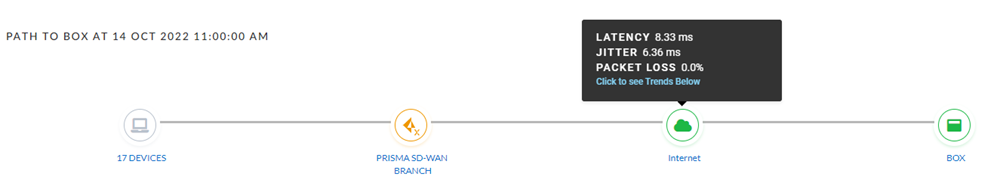
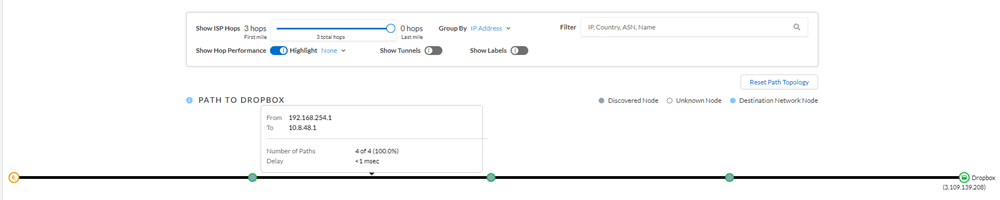
- Path to <application> - This chart allows you to quickly pinpoint which segment of the end-to-end experience is likely causing the issue— segments starting from the remote site, ISP or WAN, or the application itself—might be the cause of the issue. For each segment, you can get the trends by clicking on the node. For example, if you click on the Prisma SD_WAN Branch node you get the CPU and memory trend, clicking on Internet will display latency, jitter, and packet loss trend. Click on a segment, such as Device, Prisma SD-WAN Branch, Internet, Prisma Access, or the app name to view the associated data for that segment in the Trends or Path Visualization tabs below them. The Path Visualization tab provides detailed hop-by-hop information for each node including the performance metrics for that node.
![]()
Metric Description Availability Application availability (in percentage) during the Time Range. DNS Lookup DNS resolution time. TCP Connect Time taken to establish a TCP connection. SSL Connect Time taken to establish an SSL connection. HTTP Latency Time taken to establish an HTTP connection. Time to First Byte The total of DNS Lookup, TCP Connect, SSL Connect and HTTP Latency time results in the Time to First Byte. Data Transfer Total time taken for the entire data to be transferred. Time to Last Byte Time to First Byte + Data Transfer time. Metric Description Memory Memory used by the device at a particular time in the Time Range. Hover over the trend line to see the average amount of memory the device used during the Time Range. CPU CPU power used by the device at a particular time in the Time Range. Hover over the trend line to see the average amount of CPU the device used during the Time Range.. Battery Hover over the trend line to see the amount of battery power the device is using at any point during the Time Range. Disk Usage How much of the hard disk space has been used. Hover over the trend line to see the amount of disk space in use on the device during the Time Range. Disk Queue Length The number of outstanding requests that are waiting to be sent to the disk, a high number implies poor performance. - Path Visualization tab - This tab provides detailed hop-by-hop information for each node including the performance metrics for that node.
![]()