Autonomous DEM
Summary - Performance Trends for Remote Sites
Table of Contents
Summary - Performance Trends for Remote Sites
The Performance Trends for
Remote Sites tab gives you granular details about the
overall health of your applications and network performance metrics
to help you further isolate any issues.
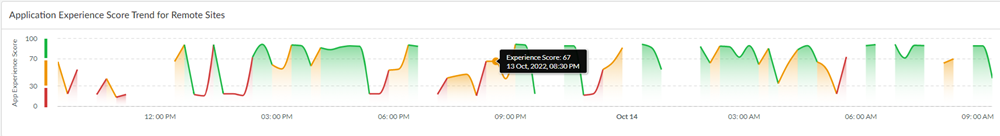
Application Experience Score Trend for Remote Sites
This widget shows the remote sites experience score
trend during the selected Time Range. Hover
your mouse cursor over the trend line to see the experience score
for that specific point in time. Refer to Time Range Filter for information
on how data point intervals are plotted.
Performance Metrics
The data shown for both App Performance Metrics as
well as Network Performance Metrics is on
an organization level. It is an aggregate for all users and all
applications running.
- App Performance Metrics
Metric Description Availability Application availability (in percentage) during the Time Range. DNS Lookup DNS resolution time. TCP Connect Time taken to establish a TCP connection. SSL Connect Time taken to establish an SSL connection. HTTP Latency Time taken to establish an HTTP connection. Time to First Byte The total of DNS Lookup, TCP Connect, SSL Connect and HTTP Latency time results in the Time to First Byte. Data Transfer Total time taken for the entire data to be transferred. Time to Last Byte Time to First Byte + Data Transfer time. - Network Performance Metrics
Metric Description Availability Network availability metrics during the Time Range. Network Latency Time taken to transfer the data over the network. Packet Loss Loss of packets during data transmission. Jitter Change in latency during the Time Range.