Log Intra Data Center Traffic That Matches the Intrazone Allow Rule
Table of Contents
Log Intra Data Center Traffic That Matches the Intrazone Allow Rule
Data centers are a good place for attackers to hide because
security often focuses on users and overlooks servers. Log east-west
traffic between servers and look for anomalous behaviors that may
indicate the presence of an attacker.
By default, all intrazone traffic (source
and destination in the same zone) is allowed. After the firewall
evaluates Security policy, it either allows traffic controlled by
application allow list rules, denies traffic controlled by block
rules, or if intrazone traffic matches no rules, the firewall allows
it by default. (The firewall blocks interzone traffic by default.)
Because of the valuable nature of data center assets, the best practice
is to monitor all traffic inside the data center between data center
servers, including traffic allowed by the intrazone default allow
rule.
To gain visibility into this traffic, enable logging
on the intrazone-default rule when it applies to traffic within
zones inside the data center. Logging this traffic gives you the
opportunity to examine access that you have not explicitly allowed
and which you may want to either explicitly allow by modifying an
allow rule or explicitly block.
In Define
the Initial Intra-Data-Center Traffic Security Policy, we
used three example zones inside the data center: Web-Server-Tier-DC, App-Server-Tier-DC,
and DB-Server-Tier-DC. In this example, we create a custom report to gather log information
about data center intrazone traffic in these three internal data
center zones.
- Select the intrazone-default row in the rulebase and click Override to enable editing the rule.
- Select the intrazone-default rule name to edit the rule.
- On the Actions tab, select Log at Session End and click OK.
- Create a custom report to monitor traffic that hits this
rule for the internal data center zones.
- Select .
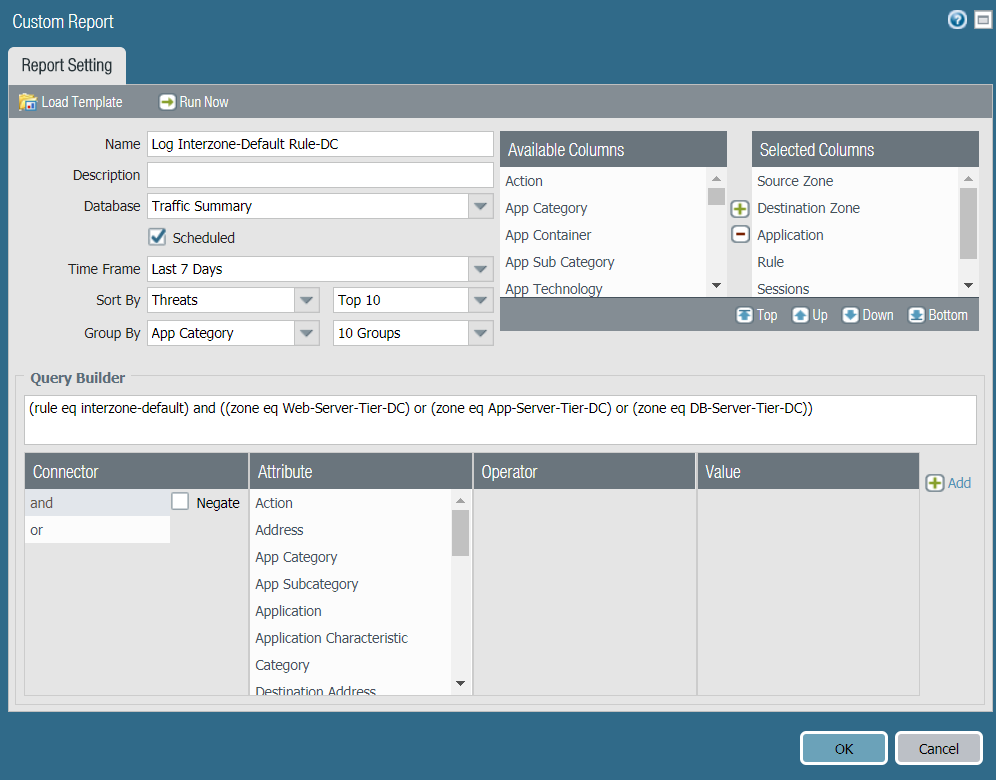
- Add a report and give it a descriptive Name. In this example, the name is Log Intrazone-Default Rule-DC.
- Set the Database to Traffic Summary.
- Select the Scheduled box.
- From Available Columns, add Application, Risk of App, Rule, and Threat to the Selected Columns list. If there are other types of information you want to monitor, select those as well.
- Set the desired Time Frame, Sort By, and Group By values. In this example, the selected values are Threats and App Category, respectively.
- Define the query to match traffic that matches the intrazone-default rule for the data center zones:
(rule eq interzone-default) and ((zone eq Web-Server-Tier-DC) or (zone eq App-Server-Tier-DC) or (zone eq DB-Server-Tier-DC))
The query filters for traffic that matches the interzone default rule and also matches any of the three internal data center zones that we defined. Because the default Selected Columns include zones, the report shows the zone for each session. In a real-world data center, you would probably have more zones and you would add each zone to the query. The resulting custom report settings look like this:![]()
- Commit the changes.