Next-Generation Firewall
How to Measure CPS
Table of Contents
How to Measure CPS
How can you measure average and peak CPS so you can get
a baseline from which to set reasonable flood thresholds?
| Where Can I Use This? | What Do I Need? |
|---|---|
| NGFW (Managed by PAN-OS or Panorama) |
|
There are many ways to measure CPS to help you set Zone
Protection profile and DoS Protection profile flood threshold settings:
- For Zone Protection profile thresholds, if you run PAN-OS 10.0 or later, the best way to measure CPS is to use the Zone Protection profile Threshold Recommendation alerts from the AIOps cloud service, which use system telemetry to provide accurate estimates of average and average peak CPS values to use in Zone Protection profiles. You can sign up firewalls and Panorama for the service. With PAN-OS 10.2.1 or later, you can install the AIOps plugin for Panorama to proactively enforce security checks on configurations before you push them to managed firewalls.
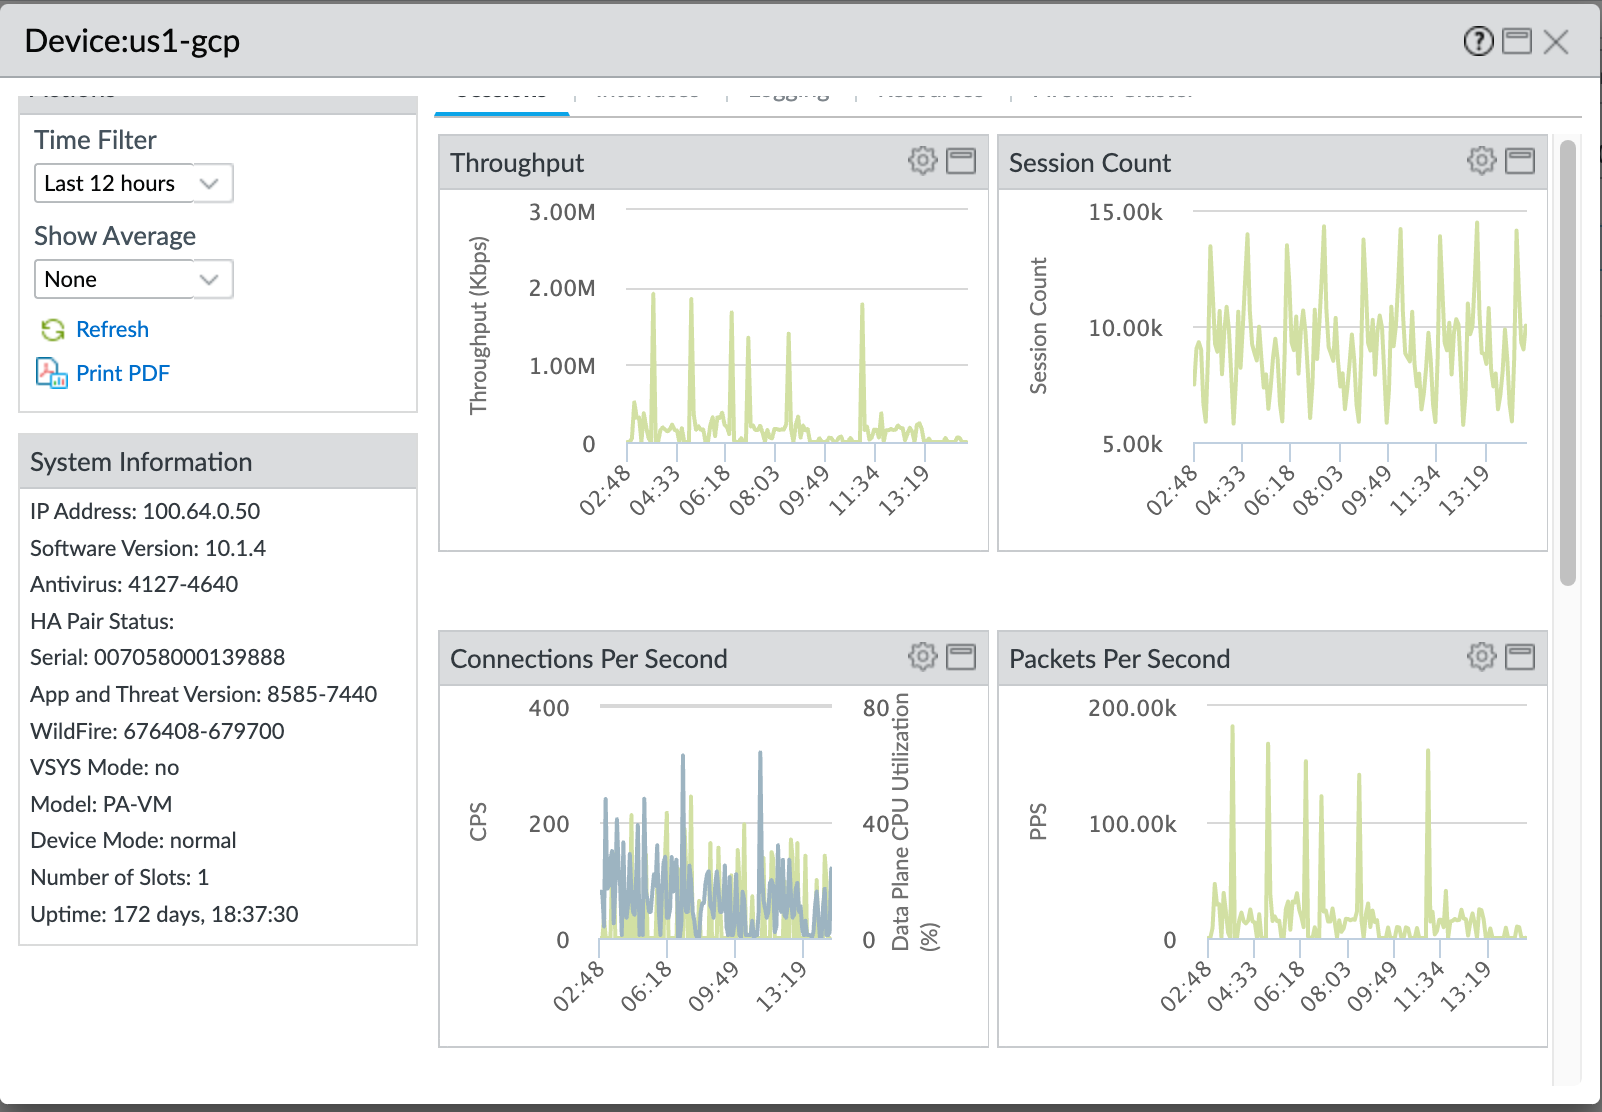
- If you use Panorama to manage your firewalls, use Device Monitoring to measure CPS coming into a firewall. Select a device to see measurements that help you understand the CPS for that device over a configurable time frame to help you understand the capacity of the firewall. Device Monitoring can also show you a 90-day trend line of CPU average and peak use to help you understand the typical available capacity of each firewall. To see how CPS impacts firewall resources, you can overlay CPS on the same timeline with metrics such as CPU utilization, packet buffers, or packet descriptors:
- .
- Click a Device Name to select a device and to view and filter device information.
![]()
- Select the gear icon to access Device Monitor annotations, overlay, and comparison actions.You can select tabs (not shown) at the top of the dialog box to see more metrics. The following illustrations show the Sessions tab. The other tabs are Interfaces, Logging, Resources, and Firewall Cluster. Each tab displays different default metrics and for each default metric, you can overlay other metrics, compare the selected device to other devices, including device slots and data planes, and annotate the metric.
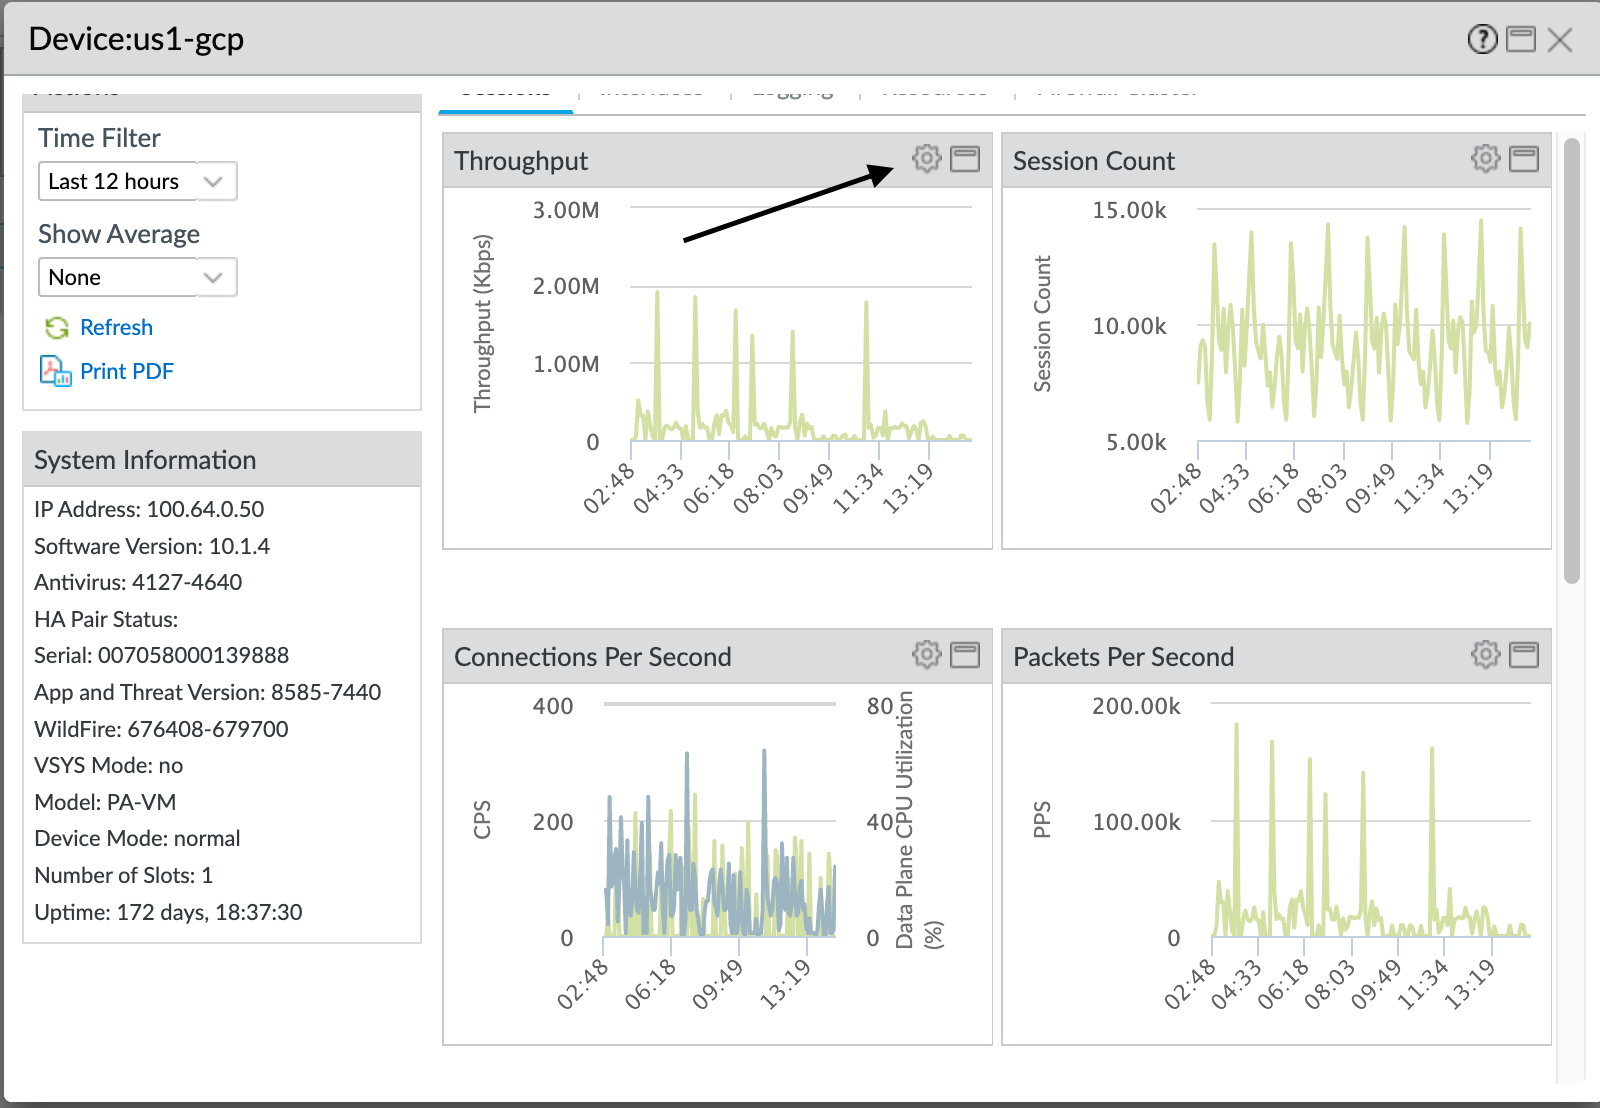
![]() The preceding screen shows the CPS data over the last 12 hours (Time Filter) overlaid with Data Plane CPU Utilization. The next step shows you how to overlay metrics on the default metrics in each tab.
The preceding screen shows the CPS data over the last 12 hours (Time Filter) overlaid with Data Plane CPU Utilization. The next step shows you how to overlay metrics on the default metrics in each tab. - Click the gear icon to see the actions you can take for overlaying other metrics on the default metrics. You can overlay one metric at a time on each default metric over a particular time frame:
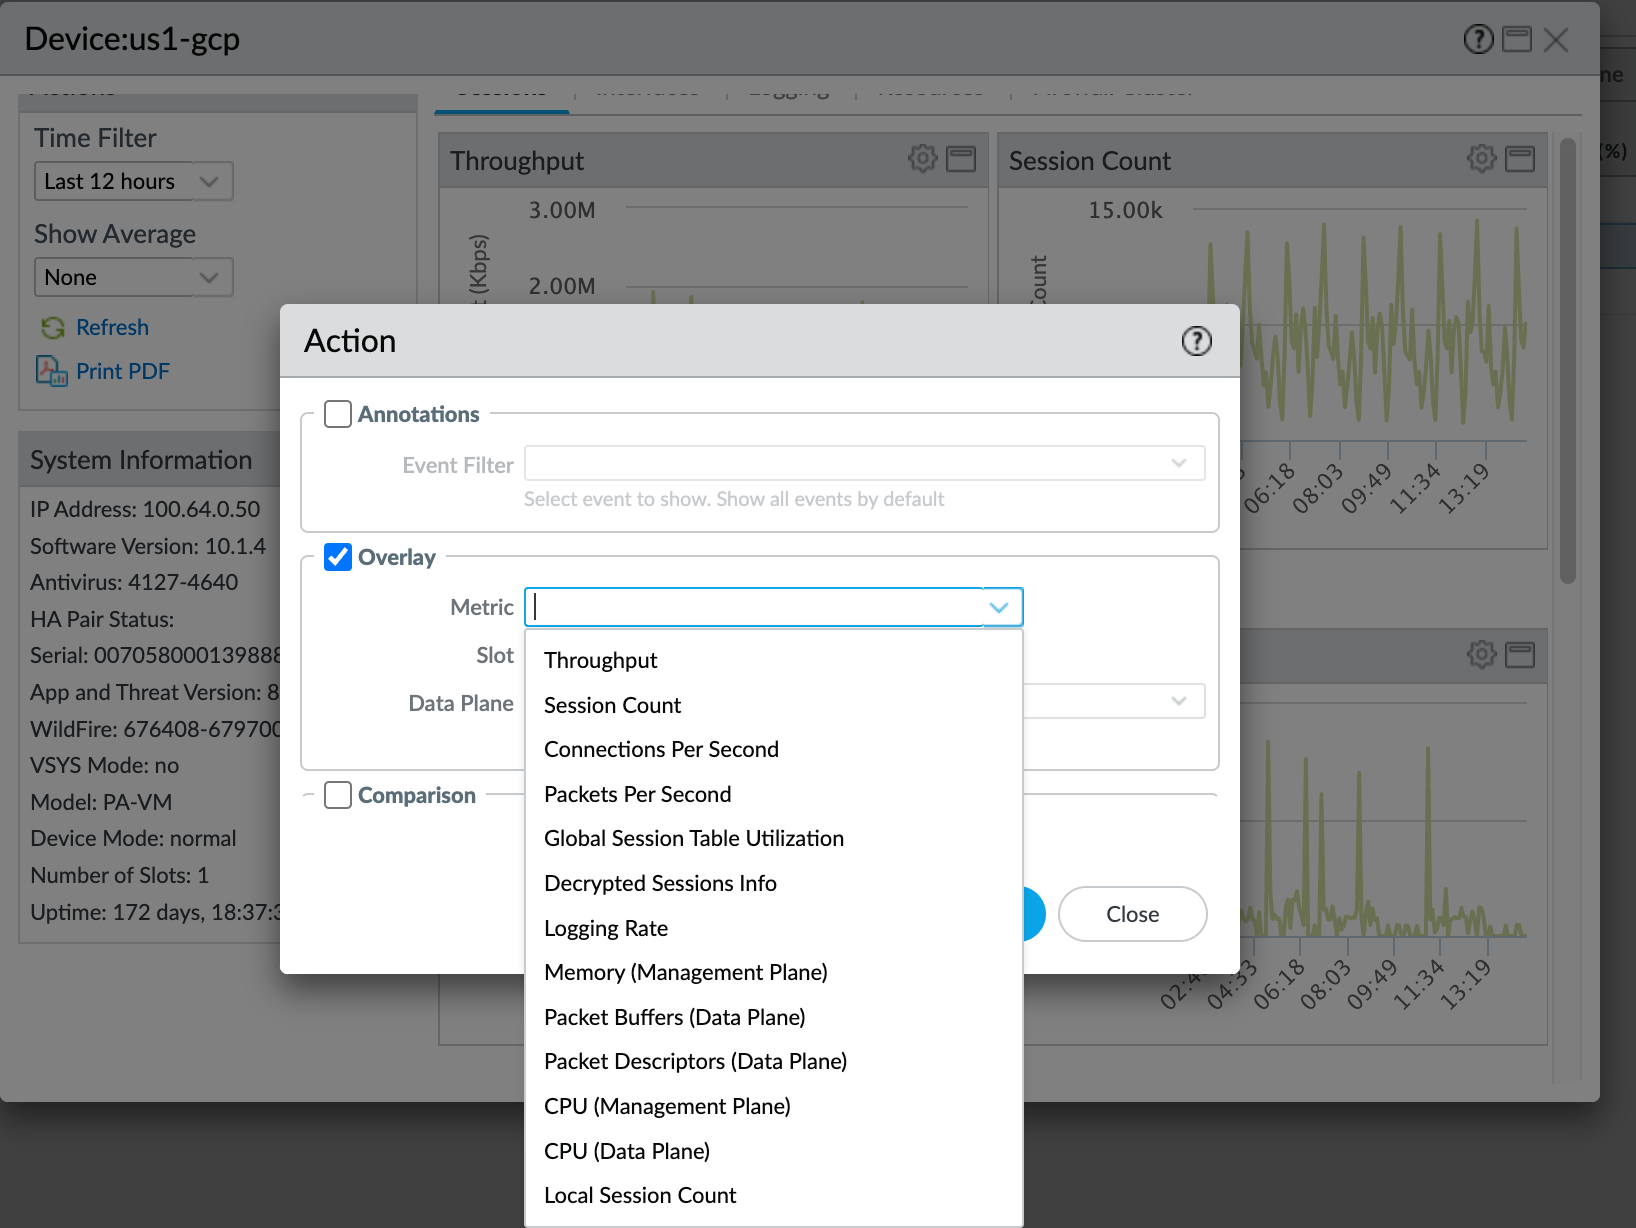
- Select Overlay to see the overlay options and then select the Metric drop-down.
![]()
- You can overlay any of these metrics on the default metrics over the same time period to see how the state of one metric affects another metric.For example, on the Sessions tab, you can overlay Data Plane Packet Buffers or Data Plane Packet Descriptors to see how high CPS, Throughput, Session Count, or Packets Per Second (PPS) conditions affect the packet buffers or packet descriptors.Another example on the Sessions tab is to overlay CPS Throughput or PPS with the Data Plane CPU and Packet Buffers metrics to see how traffic spikes affect the CPU and buffers.Another example is to select the Resources tab and then overlay Data Plane CPU over Packet Buffers to see how packet buffer utilization affects the CPU.Overlays help you see trends and correlations such as whether high buffer utilization is associated with high CPS or PPS rates, and give you an idea of how high CPS and PPS can be before they affect the CPU, packet buffers, or packet descriptors.
- Click OK to see the data overlay and use the information to understand device resource behavior under different CPS loads and conditions.
- To gather CPS data over time to help with setting Zone Protection profile thresholds, if you use an SNMP server, you can use your own management tools to poll SNMP MIBs. However, it is important to understand that the CPS measurements in the MIBs show twice the actual CPS value (for example, if the true CPS measurement is 10,000, the MIBs show 20,000 as the value; this happens because the MIBs count the C2S and S2C session segments separately instead of as a single session). You can still see trends from the MIBs and you can divide the CPS values by two to derive the true values. The SNMP MIB OIDs are: PanZoneActiveTcpCps, PanZoneActiveUdpCps, and PanZoneOtherIpCps. Because the firewall only takes measurements and updates the SNMP server every 10 seconds, poll every 10 seconds.
- Run the operational CLI command show session info.You can also see CPS values using the operational CLI command show counter interface, but this command displays two times the actual CPS value because it counts the C2S and S2C session segments separately instead of as a single session, so divide the CPS value by two to derive the real CPS value.
- DoS Protection profiles can protect servers from DoS attacks and can also prevent misconfigured or compromised servers from attacking your network. When the DoS Protection policy rule specifies a server as the destination, you’re protecting it from DoS attacks. When a rule specifies a server as the source, you’re protecting your network from inadvertent or malicious attacks on your network from that server.To measure the CPS for an individual device or to see which devices have the highest CPS rates so that you can set DoS Protection profile thresholds, use the Application Command Center (ACC). The ACC shows you server session rates that enable you to calculate the average CPS for individual devices (for classified DoS Protection policy rules) and for groups of devices (aggregate DoS Protection policy rules). Take measurements over at least a week; longer time periods provide a larger sample size and therefore more representative measurements. Use the measurements to understand the normal and peak number of connections you expect the server to receive and base your threshold settings on those measurements. To find the devices that have the highest CPS rates over a particular time period:
- Select ACC.
- Set the Time period over which to look at session traffic.
- On Network Activity, go to the Source IP Activity widget and/or the Destination IP Activity widget and select sessions (bytes is the default). You can look at source IP activity and destination IP activity at the same time to see how many sessions the device generates (source IP) and how many sessions the device receives (destination IP).
- In the widget’s source address table, click SESSIONS to show the source IP addresses with the highest session counts during the selected Time.
- To determine the CPS value for a server during the selected Time, divide the number of sessions by the number of seconds in the Time. For example, if the Time is set to Last Hour, then divide the number of sessions by 3,600 seconds to derive the CPS value.
The ACC gives you knowledge of average CPS values over time. You can check the number of sessions over the last week, month, or whatever time period makes sense for your environment to understand the session load for a device. For example, to see the session activity over the last week, set the Time to Last 7 Days and the source and destination IP widgets to sessions:![]() As an example of measuring CPS to protect a server from DoS attacks using ACC information in the illustration, let’s calculate the average CPS value over a seven day time period for the server that receives the most sessions (IP address 137.145.204.10 in the Destination IP Activity widget). We divide the 1.7 million sessions by the number of seconds in seven days (7 days x 24 hours x 60 minutes x 60 seconds = 604,800 seconds). The average is a bit less than three sessions per second for that server. Measure the CPS over time periods that represent normal average and peak traffic for the servers you want to protect and base your initial thresholds on those values. Observe the servers and adjust the thresholds as necessary to tune DoS Protection so that the servers are protected but you don’t throttle legitimate connections unnecessarily.
As an example of measuring CPS to protect a server from DoS attacks using ACC information in the illustration, let’s calculate the average CPS value over a seven day time period for the server that receives the most sessions (IP address 137.145.204.10 in the Destination IP Activity widget). We divide the 1.7 million sessions by the number of seconds in seven days (7 days x 24 hours x 60 minutes x 60 seconds = 604,800 seconds). The average is a bit less than three sessions per second for that server. Measure the CPS over time periods that represent normal average and peak traffic for the servers you want to protect and base your initial thresholds on those values. Observe the servers and adjust the thresholds as necessary to tune DoS Protection so that the servers are protected but you don’t throttle legitimate connections unnecessarily.- Measuring CPS for classified DoS Protection profiles—Classified DoS Protection profiles protect individual devices. The goal is to configure CPS thresholds in the classified DoS Protection profile and attach the profile to a DoS Protection policy rule that applies to specific servers that have similar DoS attack thresholds. For example, you can apply classified DoS Protection profiles to web servers or critical file servers to prevent a DoS attack from disrupting their availability.The thresholds you set in the profile apply to each individual device specified in the policy rule. For example, if you set a maximum rate of 5,000 CPS in a classified DoS Protection profile, then each device in the associated DoS Protection policy rule can accept up to 5,000 CPS before dropping new connections.To calculate the average and peak CPS value, specify the IP address of each device to which you want to apply classified DoS protection in Global Filters (you can specify multiple IP addresses).
- Select the Time frame over which to view session activity.
- Select sessions in the Destination IP Activity widget.
- Specify the destination IP address of each device to which you want to apply classified DoS protection in Global Filters (you can specify multiple IP addresses).You can filter firewall Traffic logs and Threat logs for the destination IP addresses of the critical devices you want to protect to obtain normal and peak session activity information.
- Add the session values together and divide the total into the number of seconds in the time period to derive the CPS value. For example, over a time period of 30 days (2,592,000 seconds), if the total number of sessions is 155,300,000, then the average CPS over that time period is approximately 60 CPS.
- Check if the number of sessions over the time period is close enough that the initial threshold values protect each device from DoS attacks but also don’t underutilize the devices.
- Fine tune the threshold values to ensure that none of the protected servers become DoS attack victims while attaining the highest safe performance for legitimate connections.
To calculate the average peak CPS, use the graphic display in the widget to identify the peak session periods and calculate the average peak CPS from that. - Measuring CPS for aggregate DoS Protection profiles—Aggregate DoS Protection profiles protect groups of devices. The goal is to configure CPS thresholds in the aggregate DoS Protection profile and attach the profile to a DoS Protection policy rule that applies to an entire group of servers. Aggregate DoS Protection adds another layer of broad protection after your dedicated large-capacity perimeter DDoS device and the firewall’s Zone Protection.Aggregate profiles don’t apply the configured threshold to each individual device in the way that classified profiles do. Instead, the threshold applies to the entire protected group. For example, if you set a maximum CPS threshold of 20,000 sessions to a group of five servers, then the combined total sessions that the group can support is 20,000 sessions. The only limit for an individual server in the group is how many of the 20,000 sessions are available. One device could receive 15,000 CPS, which leaves up to 5,000 CPS for the other four devices combined.Adjust the thresholds as needed. You can use the same process for finding normal and peak CPS for classified profiles in the ACC to find average normal and peak CPS for aggregate profiles. Keep in mind that for aggregate profiles, you need to base the thresholds on the group’s total CPS, not on the CPS to individual servers.
- To prevent a server or servers from inadvertently or maliciously attacking your network, base your CPS measurements on the Source IP Activity widget, which shows the session activity that servers generate. Filter by sessions to see the most active servers or use Global Settings to filter by the source IP address of a particular server or servers. In the DoS Protection policy rule for the server(s), apply a DoS Protection profile with low thresholds so that the server can’t disrupt the network. For example, thresholds of 10 CPS for Alarm Rate, 20 CPS for Activate Rate, and 30 CPS for Max Rate ensure that the firewall adds the source address to the hardware block table instead of using other system resources.
- For setting aggregate DoS Protection profile thresholds, you can use Zone Protection profile threshold measurements as a starting point, especially if you intend to cover most of the servers in a zone with aggregate DoS protection. If the zone contains only the devices to which you want to apply an aggregate DoS Protection profile, then the CPS numbers are exactly the same as the Zone Protection profile numbers. If the zone contains both devices that you want to protect with an aggregate DoS Protection profile and devices that you don’t want to protect with an aggregate DoS Protection profile, you can use the Zone Protection CPS measurements as a starting point and experiment with the thresholds to tune them properly.
- Use third-party tools such as Wireshark or NetFlow to collect and analyze network traffic.
- Use scripts to automate CPS information collection and continuous monitoring, and to mine information from the logs.
- Configure every Security policy rule on the firewall to Log at Session End. If you have no monitoring tools such as NetFlow or Wireshark, and cannot obtain or develop automated scripts, Log at Session End captures the number of connections at the session end. While this doesn’t provide CPS information, it does show you the number of sessions ending in the selected time duration and you can make an approximate calculation of the sessions per second from that information.
- Work with application teams to understand the normal and peak CPS to their servers and the maximum CPS those servers can support.

To conserve resources, the firewall measures the aggregate
CPS at ten-second intervals. For this reason, measurements you see
on the firewall may not catch bursts within the ten-second interval.
Although the average CPS measurements aren’t affected, the peak
CPS measurements may not be precise. For example, if the firewall
logs report a 5,000 CPS average in a ten-second interval, it’s possible
that 4,000 CPS came in a one-second burst and the other 1,000 CPS were
spread out over the remaining nine seconds.
Create separate log forwarding profiles for
flood events so the appropriate administrator receives emails that
contain only flood (potential DoS attack) events. Set Log Forwarding
for both zone protection and DoS protection threshold events.
After you implement Zone and DoS protection,
use these methods to monitor the deployment, so as your network
evolves and traffic patterns change, you adjust flood protection
thresholds.