Prisma SD-WAN
Prisma SD-WAN Application Insights
Table of Contents
Expand All
|
Collapse All
Prisma SD-WAN Docs
-
-
- Prisma SD-WAN Key Elements
- Prisma SD-WAN Releases and Upgrades
- Use Copilot in Prisma SD-WAN
- Prisma SD-WAN Summary
- Prisma SD-WAN Application Insights
- Device Activity Charts
- Site Summary Dashboard
- Prisma SD-WAN Predictive Analytics Dashboard
- Prisma SD-WAN Link Quality Dashboard
- Prisma SD-WAN Subscription Usage
-
-
- Add a Branch
- Add a Data Center
- Add a Branch Gateway
- Secure Group Tags (SGT) Propagation
- Configure Circuits
- Configure Internet Circuit Underlay Link Aggregation
- Configure Private WAN Underlay Link Quality Aggregation
- Configure Circuit Categories
- Configure Device Initiated Connections for Circuits
- Add Public IP LAN Address to Enterprise Prefixes
- Manage Data Center Clusters
- Configure Secure SD-WAN Fabric Tunnels between Data Centers
- Configure a Site Prefix
- Configure Ciphers
- Configure a DHCP Server
- Configure NTP for Prisma SD-WAN
- Configure the ION Device at a Branch Site
- Configure the ION Device at a Data Center
- Switch a Site to Control Mode
- Allow IP Addresses in Firewall Configuration
-
- Configure a Controller Port
- Configure Internet Ports
- Configure WAN/LAN Ports
- Configure a Sub-Interface
- Configure a Loopback Interface
- Add and Configure Port Channel Interface
- Configure a PoE Port
- Configure and Monitor LLDP Activity and Status
- Configure a PPPoE Interface
- Configure a Layer 3 LAN Interface
- Configure Application Reachability Probes
- Configure a Secondary IP Address
- Configure a Static ARP
- Configure a DHCP Relay
- Configure IP Directed Broadcast
- VPN Keep-Alives
-
- Configure Prisma SD-WAN IPFIX
- Configure IPFIX Profiles and Templates
- Configure and Attach a Collector Context to a Device Interface in IPFIX
- Configure and Attach a Filter Context to a Device Interface in IPFIX
- Configure Global and Local IPFIX Prefixes
- Flow Information Elements
- Options Information Elements
- Configure the DNS Service on the Prisma SD-WAN Interface
- Configure SNMP
-
-
- Prisma SD-WAN Branch Routing
- Prisma SD-WAN Data Center Routing
-
- Configure an OSPF in Prisma SD-WAN
- Enable BGP for Private WAN and LAN
- Configure BGP Global Parameters
- Global or Local Scope for BGP Peers
- Configure a Route Map
- Configure a Prefix List
- Configure an AS Path List
- Configure an IP Community List
- View Routing Status and Statistics
- Distribution to Fabric
- Host Tracking
-
- Configure Multicast
- Create, Assign, and Configure a WAN Multicast Configuration Profile
- Configure Global Multicast Parameters
- Configure a Multicast Static Rendezvous Point (RP)
- Learn Rendezvous Points (RPs) Dynamically
- View LAN Statistics for Multicast
- View WAN Statistics for Multicast
- View IGMP Membership
- View the Multicast Route Table
- View Multicast Flow Statistics
- View Routing Statistics
-
- Prisma SD-WAN Branch HA Key Concepts
-
- Configure Branch HA with Gen-1 Platforms (2000, 3000, 7000, and 9000)
- Configure Branch HA with Gen-2 Platforms (3200, 5200, and 9200)
- Configure Branch HA with Gen-2 Embedded Switch Platforms (1200-S or 3200-L2)
- Configure Branch HA for Devices with Software Cellular Bypass (1200-S-C-5G)
- Configure Branch HA for Platforms without Bypass Pairs
- Configure Branch HA in a Hybrid Topology with Gen-1 (3000) and Gen-2 (3200) Platforms
- Configure HA Groups
- Add ION Devices to HA Groups
- Edit HA Groups and Group Membership
- Prisma SD-WAN Clarity Reports
-
-
CloudBlade Integrations
- CloudBlade Integrations
- CloudBlades Integration with Prisma Access
-
-
-
-
- clear app-engine
- clear app-map dynamic
- clear app-probe prefix
- clear connection
- clear device account-login
- clear dhcplease
- clear dhcprelay stat
- clear flow and clear flows
- clear flow-arp
- clear qos-bwc queue-snapshot
- clear routing
- clear routing multicast statistics
- clear routing ospf
- clear routing peer-ip
- clear switch mac-address-entries
- clear user-id agent statistics
-
- arping interface
- curl
- ping
- ping6
- debug bounce interface
- debug bw-test src-interface
- debug cellular stats
- debug controller reachability
- debug flow
- debug ipfix
- debug log agent eal file log
- debug logging facility
- debug logs dump
- debug logs follow
- debug logs tail
- debug performance-policy
- debug poe interface
- debug process
- debug reboot
- debug routing multicast log
- debug routing multicast pimd
- debug servicelink logging
- debug tcpproxy
- debug time sync
- dig dns
- dig6
- file export
- file remove
- file space available
- file tailf log
- file view log
- ssh6 interface
- ssh interface
- tcpdump
- tcpping
- traceroute
- traceroute6
-
- dump appdef config
- dump appdef version
- dump app-engine
- dump app-l4-prefix table
- dump app-probe config
- dump app-probe flow
- dump app-probe prefix
- dump app-probe status
- dump auth config
- dump auth status
- dump banner config
- dump bfd status
- dump bypass-pair config
- dump cellular config
- dump cellular stats
- dump cellular status
- dump cgnxinfra status
- dump cgnxinfra status live
- dump cgnxinfra status store
- dump config network
- dump config security
- dump controller cipher
- dump controller status
- dump device accessconfig
- dump device conntrack count
- dump device date
- dump device info
- dump device status
- dump dhcp-relay config
- dump dhcprelay stat
- dump dhcp-server config
- dump dhcp-server status
- dump dhcpstat
- dump dnsservice config all
- dump dpdk cpu
- dump dpdk interface
- dump dpdk port status
- dump dpdk stats
- dump flow
- dump flow count-summary
- dump interface config
- dump interface status
- dump interface status interface details
- dump interface status interface module
- dump intra cluster tunnel
- dump ipfix config collector-contexts
- dump ipfix config derived-exporters
- dump ipfix config filter-contexts
- dump ipfix config ipfix-overrides
- dump ipfix config prefix-filters
- dump ipfix config profiles
- dump ipfix config templates
- dump lldp
- dump lldp config
- dump lldp info
- dump lldp stats
- dump lldp status
- dump log-agent eal conn
- dump log-agent eal response-time
- dump log-agent eal stats
- dump log-agent config
- dump log-agent iot snmp config
- dump log-agent iot snmp device discovery stats
- dump log-agent ip mac bindings
- dump log-agent neighbor discovery stats
- dump log-agent status
- dump ml7 mctd counters
- dump ml7 mctd session
- dump ml7 mctd version
- dump nat counters
- dump nat6 counters
- dump nat summary
- dump network-policy config policy-rules
- dump network-policy config policy-sets
- dump network-policy config policy-stacks
- dump network-policy config prefix-filters
- dump overview
- dump performance-policy config policy-rules
- dump performance-policy config policy-sets
- dump performance-policy config policy-set-stacks
- dump performance-policy config threshold-profile
- dump poe system config
- dump poe system status
- dump priority-policy config policy-rules
- dump priority-policy config policy-sets
- dump priority-policy config policy-stacks
- dump priority-policy config prefix-filters
- dump probe config
- dump probe profile
- dump radius config
- dump radius statistics
- dump radius status
- dump reachability-probe config
- dump qos-bwc config
- dump reachability-probe status
- dump routing aspath-list
- dump routing cache
- dump routing communitylist
- dump routing multicast config
- dump routing multicast igmp
- dump routing multicast interface
- dump routing multicast internal vif-entries
- dump routing multicast mroute
- dump routing multicast pim
- dump routing multicast sources
- dump routing multicast statistics
- dump routing multicast status
- dump routing ospf
- dump routing peer advertised routes
- dump routing peer config
- dump routing peer neighbor
- dump routing peer received-routes
- dump routing peer routes
- dump routing peer route-via
- dump routing peer status
- dump routing peer route-json
- dump routing prefixlist
- dump routing prefix-reachability
- dump routing route
- dump routing routemap
- dump routing running-config
- dump routing summary
- dump routing static-route reachability-status
- dump routing static-route config
- dump routing vpn host tracker
- dump security-policy config policy-rules
- dump security-policy config policy-set
- dump security-policy config policy-set-stack
- dump security-policy config prefix-filters
- dump security-policy config zones
- dump sensor type
- dump sensor type summary
- dump serviceendpoints
- dump servicelink summary
- dump servicelink stats
- dump servicelink status
- dump site config
- dump snmpagent config
- dump snmpagent status
- dump software status
- dump spoke-ha config
- dump spoke-ha status
- dump standingalarms
- dump static-arp config
- dump static host config
- dump static routes
- dump support details
- dump-support
- dump switch fdb vlan-id
- dump switch port status
- dump switch vlan-db
- dump syslog config
- dump syslog-rtr stats
- dump syslog status
- dump time config
- dump time log
- dump time status
- dump troubleshoot message
- dump user-id agent config
- dump user-id agent statistics
- dump user-id agent status
- dump user-id agent summary
- dump user-id groupidx
- dump user-id group-mapping
- dump user-id ip-user-mapping
- dump user-id statistics
- dump user-id status
- dump user-id summary
- dump user-id useridx
- dump vlan member
- dump vpn count
- dump vpn ka all
- dump vpn ka summary
- dump vpn ka VpnID
- dump vpn status
- dump vpn summary
- dump vrf
- dump waninterface config
- dump waninterface summary
-
- inspect app-flow-table
- inspect app-l4-prefix lookup
- inspect app-map
- inspect certificate
- inspect certificate device
- inspect cgnxinfra role
- inspect connection
- inspect dhcplease
- inspect dhcp6lease
- inspect dpdk ip-rules
- inspect dpdk vrf
- inspect fib
- inspect fib-leak
- inspect flow-arp
- inspect flow brief
- inspect flow-detail
- inspect flow internal
- inspect interface stats
- inspect ipfix exporter-stats
- inspect ipfix collector-stats
- inspect ipfix app-table
- inspect ipfix wan-path-info
- inspect ipfix interface-info
- inspect ip-rules
- inspect ipv6-rules
- inspect lqm stats
- inspect memory summary
- inspect network-policy conflicts
- inspect network-policy dropped
- inspect network-policy hits policy-rules
- inspect network-policy lookup
- inspect performance-policy fec status
- inspect policy-manager status
- inspect policy-mix lookup-flow
- inspect priority-policy conflicts
- inspect priority-policy dropped
- inspect priority-policy hits default-rule-dscp
- inspect priority-policy hits policy-rules
- inspect priority-policy lookup
- inspect performance-policy incidents
- inspect performance-policy lookup
- inspect performance-policy hits analytics
- inspect process status
- inspect qos-bwc debug-state
- inspect qos-bwc queue-history
- inspect qos-bwc queue-snapshot
- inspect routing multicast fc site-iface
- inspect routing multicast interface
- inspect routing multicast mroute
- inspect security-policy lookup
- inspect security-policy size
- inspect switch mac-address-table
- inspect system arp
- inspect system ipv6-neighbor
- inspect system vrf
- inspect vrf
- inspect wanpaths
-
-
5.6
- 5.6
- 6.1
- 6.2
- 6.3
- 6.4
- 6.5
- New Features Guide
- On-Premises Controller
- Prisma SD-WAN CloudBlades
- Prisma Access CloudBlade Cloud Managed
- Prisma Access CloudBlade Panorama Managed
-
- Features Introduced in Prisma SD-WAN ION Release 5.6
- Changes to Default Behavior in Prisma SD-WAN ION Release 5.6
- Upgrade ION 9000 Firmware for Device Version 5.6.x
- CLI Commands in Prisma SD-WAN ION Release 5.6
- Addressed Issues in Prisma SD-WAN ION Release 5.6
- Known Issues in Prisma SD-WAN ION Release 5.6
Prisma SD-WAN Application Insights
Let us learn more about the Applications dashboard for Prisma SD-WAN.
Where Can I Use This? | What Do I Need? |
---|---|
|
|
Identifies the top applications which are not performing well. The
Applications widget displays the determined health score of
all poor applications, lists poor applications for a tenant based on health score, and
plots the average health score of poor applications for the last 3 hours in 5 minutes
intervals.
Select Monitor > Applications to view the Applications screen.
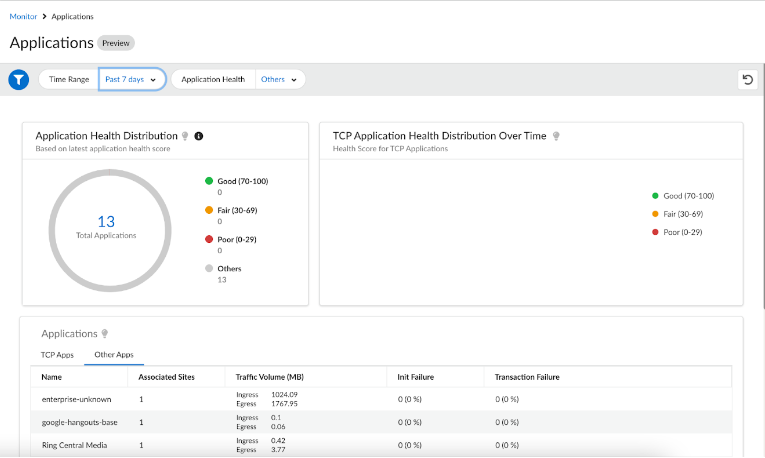
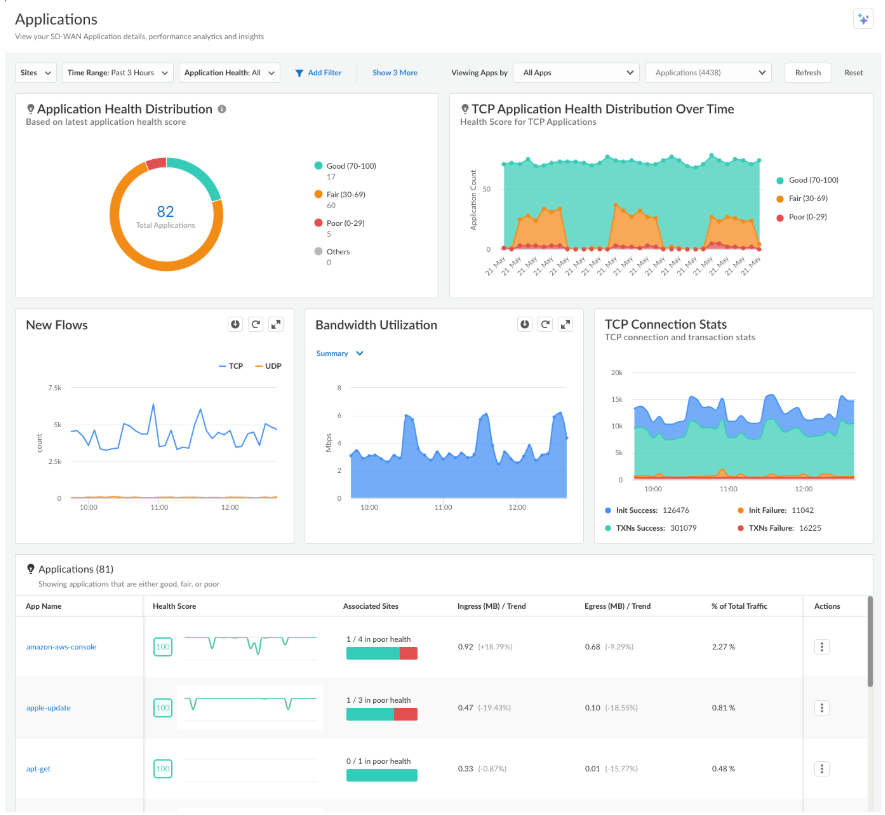
- Application Health Distribution—The distribution of Good, Fair, and Poor Applications for a given tenant.
- Application Health Distribution Over Time—The Time series graph of Application Health Distribution Over Time displays the Good, Fair, and Poor Applications for a given tenant. The time-series graph should be computed and refreshed based on the selected duration. For example, supported durations are 1 hour, 3 hours, one day, seven days, 30 days, and 90 days and the interval is 1 minute, 5 minutes, 1 hour, and one day, respectively.
- Applications—The Applications list/table list all the Applications details such as Name, Application Profile, Health Score, Impacted Sites, Traffic Volume, Init/Failure, and Transaction/Failure. When you click the Application Name, you can see the individual App Details on a new page.
You can view TCP Application Health Distribution Over Time and
Application Health Distribution only with WCR license.
You can click on the Time Series chart to see the details of those
applications in the TCP Apps tab. Then, when drilling down on the
chart, click on the Reset icon (on the top right corner of the
TCP Application Health Distribution Over Time chart). You can
always return to the original view per global filters by clicking on the reset icon. In
addition, the screen shows the message at which date and time you are viewing the
details.
The application's health score is assessed per path, focusing on metrics such as
application RTT and packet loss. Among these metrics, RTT is predominant in determining
the health score. Additionally, packet loss within the path can impact the application's
performance, enhancing the accuracy of our health evaluation.
Click on the number under the Paths column from the application
details to see path-level information, which leads to the Path Detail
page. The Path Detail page includes information for
Application Health Score for Application and Site and
Statistics Data aggregated at the Application and Site level.
You can view detailed information by clicking on App Details and
Links Details links, which will lead you to the Activity
chart in a new browser tab.
