Prisma SD-WAN
Monitor Tenant Devices, Branches, and Alarms
Table of Contents
Monitor Tenant Devices, Branches, and Alarms
Monitor the health of your devices across all your tenants. Monitor the health of your
branches and monitor your tenant alarms from the Prisma SD-WAN MSP
Portal.
| Where Can I Use This? | What Do I Need? |
|---|---|
|
|
Monitor the health of your devices across
all your tenants from the Prisma SD-WAN MSP Portal.
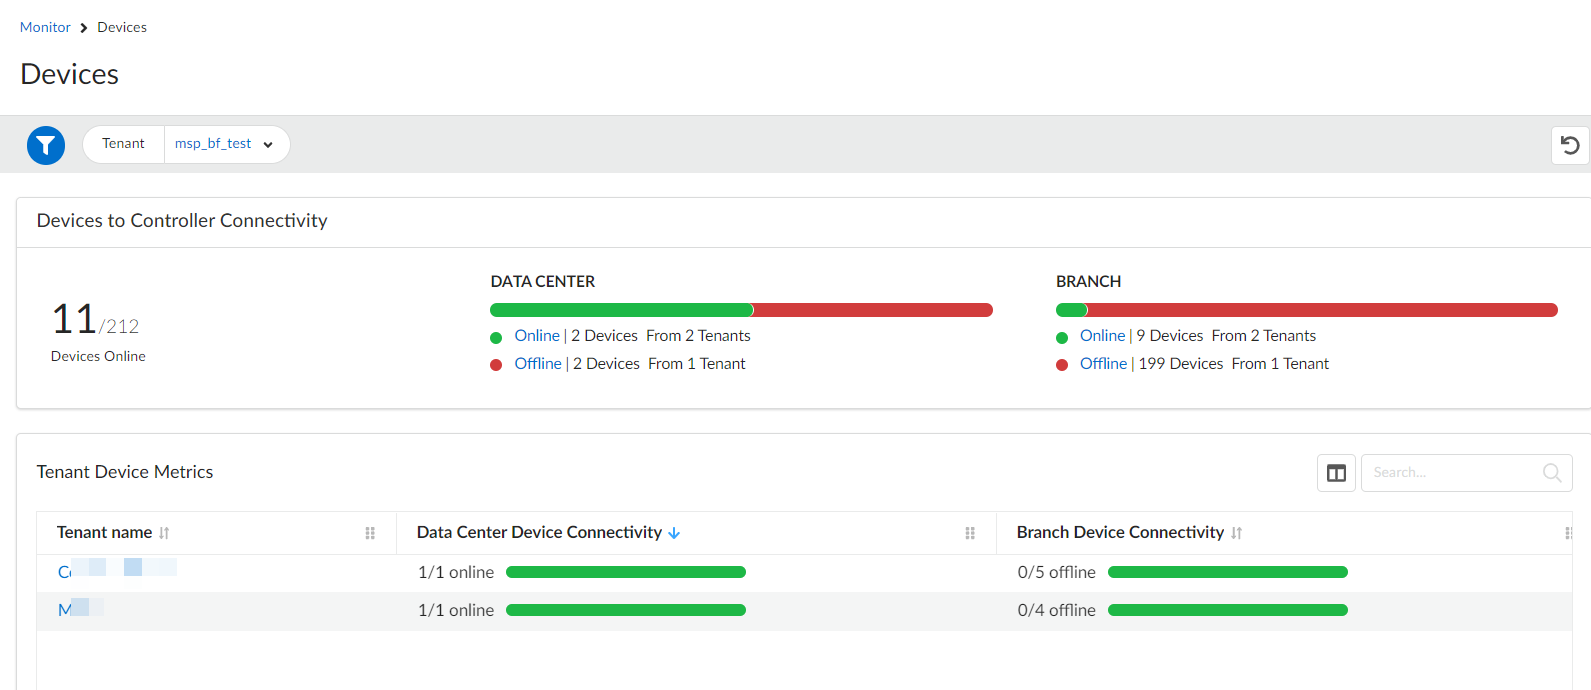
- Select .Use the following widgets to monitor the health of your devices.Devices to Controller ConnectivityThe Devices to Controller Connectivity widget depicts the number of online and offline devices connected to the Prisma SD-WAN controller for a branch and data center site across your tenants.Tenant Device MetricsThe Tenant Device Metrics widget displays the number of online and offline devices for individual tenants. Click a tenant to view the details for the online and offline devices for the tenant.Click the User icon and select MSP Portal to return to the MSP portal.
![]() You can sort devices for branches and data centers based on their connectivity to the controller by clicking Online or Offline on the Devices to Controller Connectivity widget. For example, when you click Online under the Data Center column on the Devices to Controller Connectivity widget, the Data Center Device Connectivity column on the Tenant Device Metrics widget displays the number of online data center devices.
You can sort devices for branches and data centers based on their connectivity to the controller by clicking Online or Offline on the Devices to Controller Connectivity widget. For example, when you click Online under the Data Center column on the Devices to Controller Connectivity widget, the Data Center Device Connectivity column on the Tenant Device Metrics widget displays the number of online data center devices.Monitor Tenant Branches
Monitor the health of your branches across all your tenants from the Prisma SD-WAN MSP Portal.- Select .The Branch and Branch Link Health widget displays the link health for all branches.
- Good—Indicates a health score>80.
- Fair—Indicates a health score between 60-80.
- Poor—Indicates a health score<60.
The Tenant Branch Metrics widget displays branch health and link health for branches for individual tenants.(Optional) Click a Tenant name to view the dashboard for a tenant.Click the User icon and select MSP Portal to return to the MSP portal.Monitor Tenant Alarms
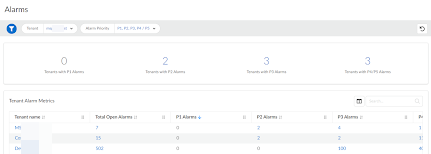
Monitor the open alarms for devices across all your tenants.- Select Alarms on the left pane.
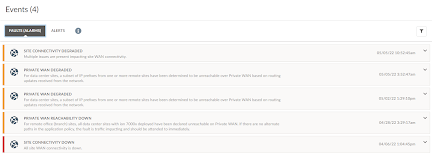
![]() The Alarms page displays alarms based on priority.The Tenant Alarm Metrics widget displays the total open alarms and alarms based on priority for individual tenants.You can filter alarms based on priority. For example, when you click the count for Tenant with P2 Alarms, the Tenant Alarm Metrics widget sorts tenants based on the number of open P2 alarms. The default sorting is based on P1 alarms.(Optional) Click a Tenant name or an Alarm to view details of the alarms for the tenant.
The Alarms page displays alarms based on priority.The Tenant Alarm Metrics widget displays the total open alarms and alarms based on priority for individual tenants.You can filter alarms based on priority. For example, when you click the count for Tenant with P2 Alarms, the Tenant Alarm Metrics widget sorts tenants based on the number of open P2 alarms. The default sorting is based on P1 alarms.(Optional) Click a Tenant name or an Alarm to view details of the alarms for the tenant.![]()