Prisma SD-WAN
Monitor Switch Activity and Statistics
Table of Contents
Monitor Switch Activity and Statistics
Lets learn how to configure monitor switch activity and statistics in Prisma
SD-WAN.
| Where Can I Use This? | What Do I Need? |
|---|---|
|
|
Monitor the L2 Switch activity and statistics
from the Prisma SD-WAN user interface.
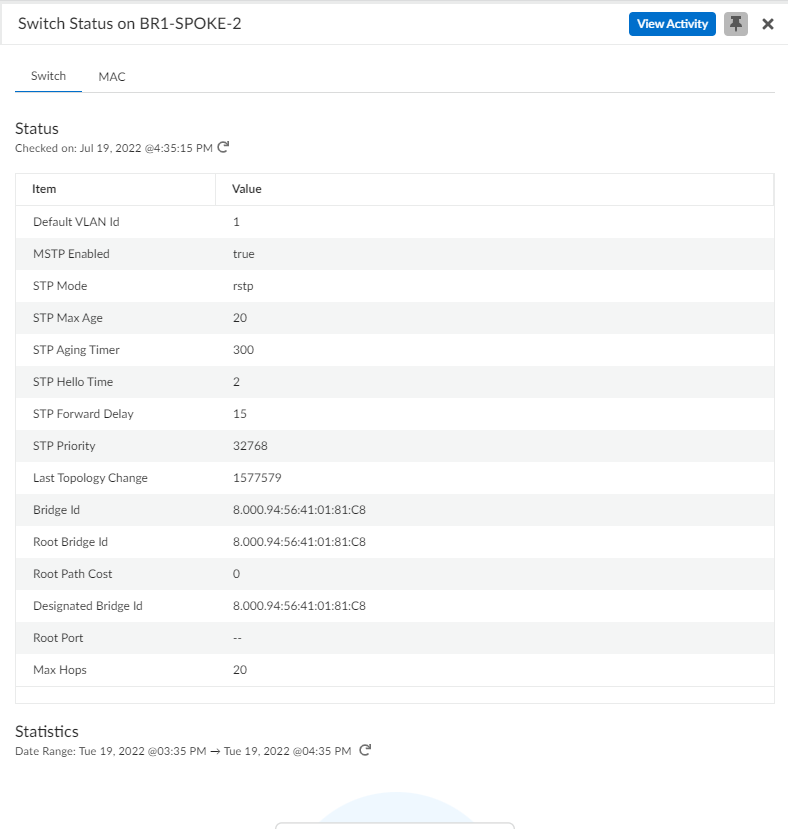
- Select .Click the Stats icon to view the Switch statistics.
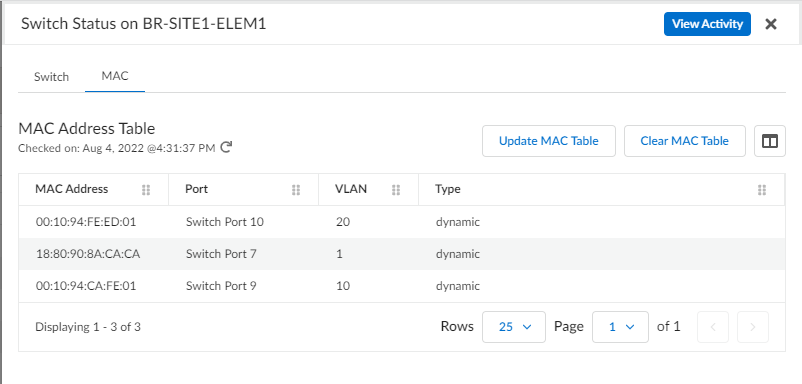
![]() Select MAC to view the MAC address table.
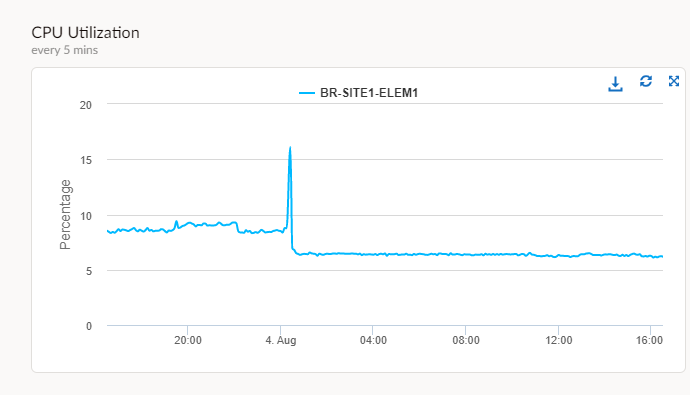
Select MAC to view the MAC address table.![]() Select Update MAC table to update the table.View the Switch Activity by clicking the View Activity icon.The following activity reports are available on the Activity dashboard.
Select Update MAC table to update the table.View the Switch Activity by clicking the View Activity icon.The following activity reports are available on the Activity dashboard.- CPU Utilization
![]()
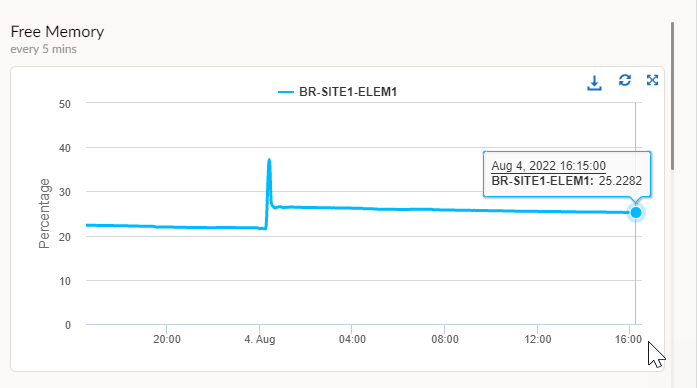
- Free Memory
![]()
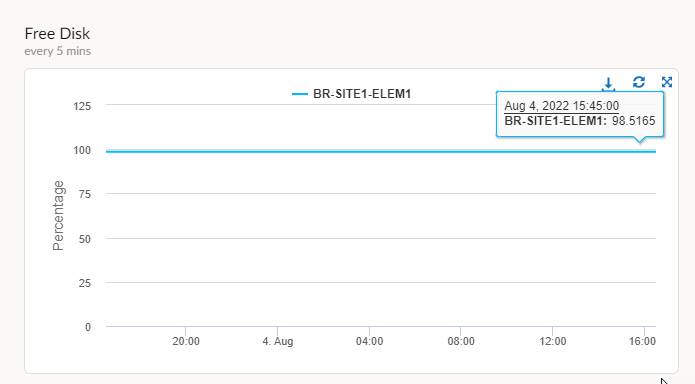
- Free Disk
![]()
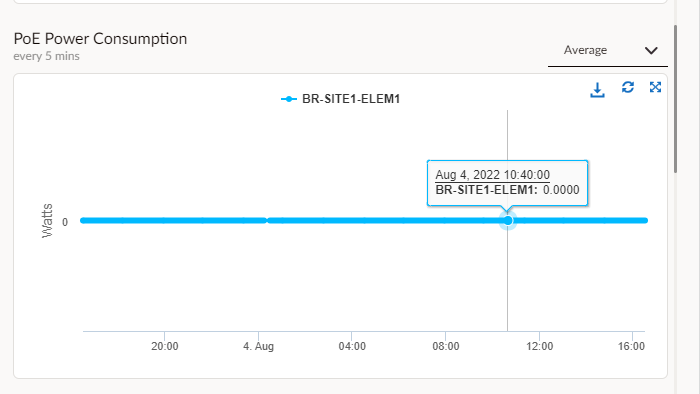
- PoE Power Consumption
![]()
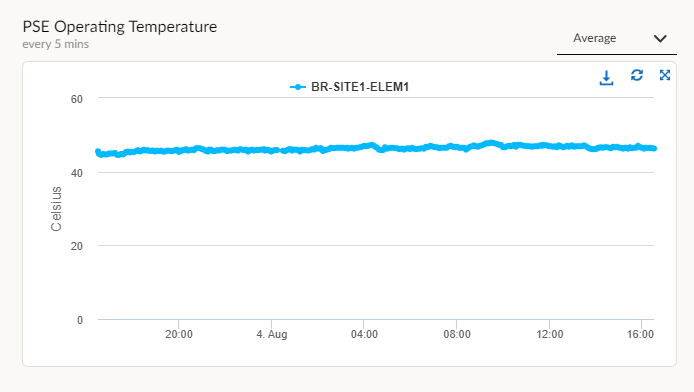
- PSE Operating Temperature
![]()
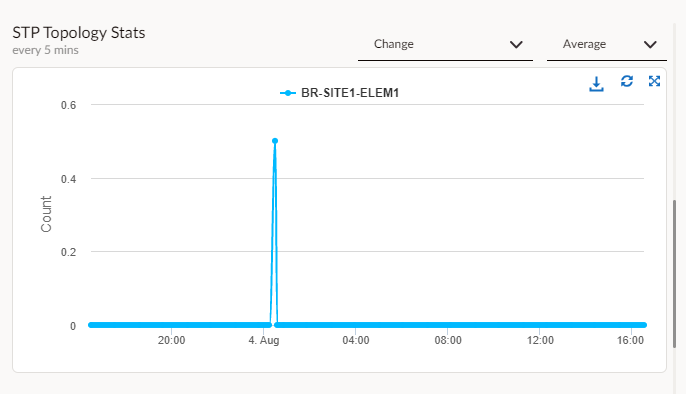
- STP Topology Stats
![]()
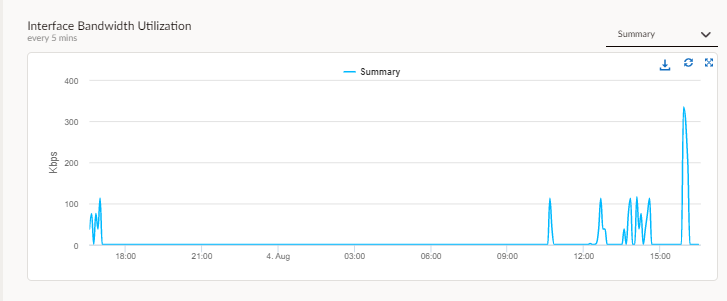
- Interface Bandwidth Utilization
![]()
- Interface Dropped Packets
- Interface Errors
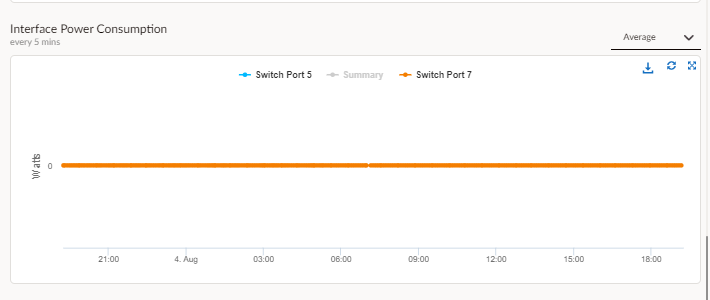
- Interface Power Consumption
![]()
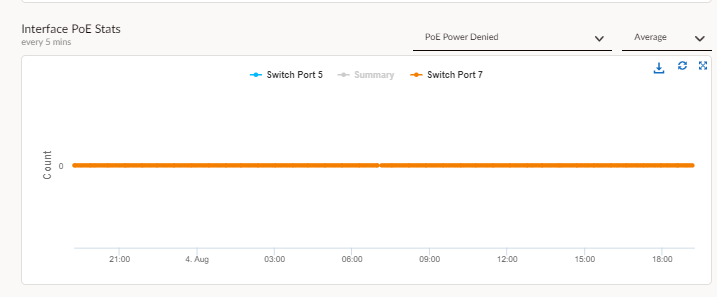
- Interface PoE stats
![]()
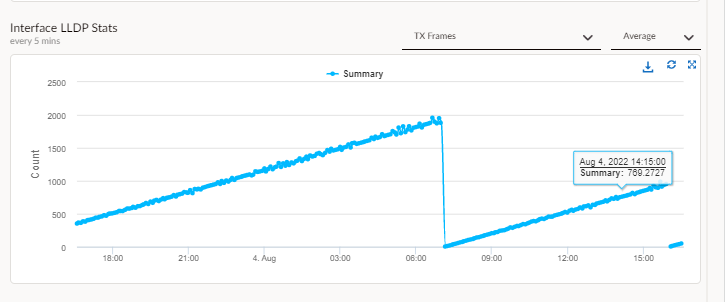
- Interface LLDP Stats
![]()
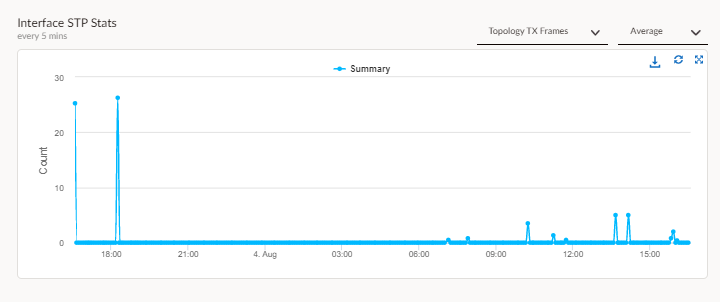
- Interface STP Stats
![]()