Prisma SD-WAN
View Flows Tab
Table of Contents
Expand All
|
Collapse All
Prisma SD-WAN Docs
-
-
-
- CloudBlade Integrations
- CloudBlades Integration with Prisma Access
-
-
-
-
- 5.6
- 6.1
- 6.2
- 6.3
- 6.4
- 6.5
- New Features Guide
- On-Premises Controller
- Prisma SD-WAN CloudBlades
- Prisma Access CloudBlade Cloud Managed
- Prisma Access CloudBlade Panorama Managed
View Flows Tab
The f lows give insights into various network flows, such as branch-to-branch,
branch-to-data center, and branch-to-third-party VPN connections.
| Where Can I Use This? | What Do I Need? |
|---|---|
|
|
Flows give insights into various network flows, such as branch-to-branch,
branch-to-data center, and branch-to-third-party VPN connections. This view helps
identify network issues, understand traffic routing, and assess how network policies
impact specific flows.
Flow details improve visibility into network traffic by offering end-to-end session
details. They allow you to visualize a flow’s path across multiple sites and network
segments, enhancing troubleshooting, traffic analysis, and network optimization.
You can leverage flow details to diagnose network problems that span multiple sites
or involve many segments. This feature minimizes the time and effort required to
correlate information from various sources, accelerating problem resolution and
enhancing network management.
Additionally, flow details support network security audits and compliance checks by
providing information about flow paths, security policies, and traffic
characteristics, ensuring network traffic aligns with security policies and
regulatory requirements.
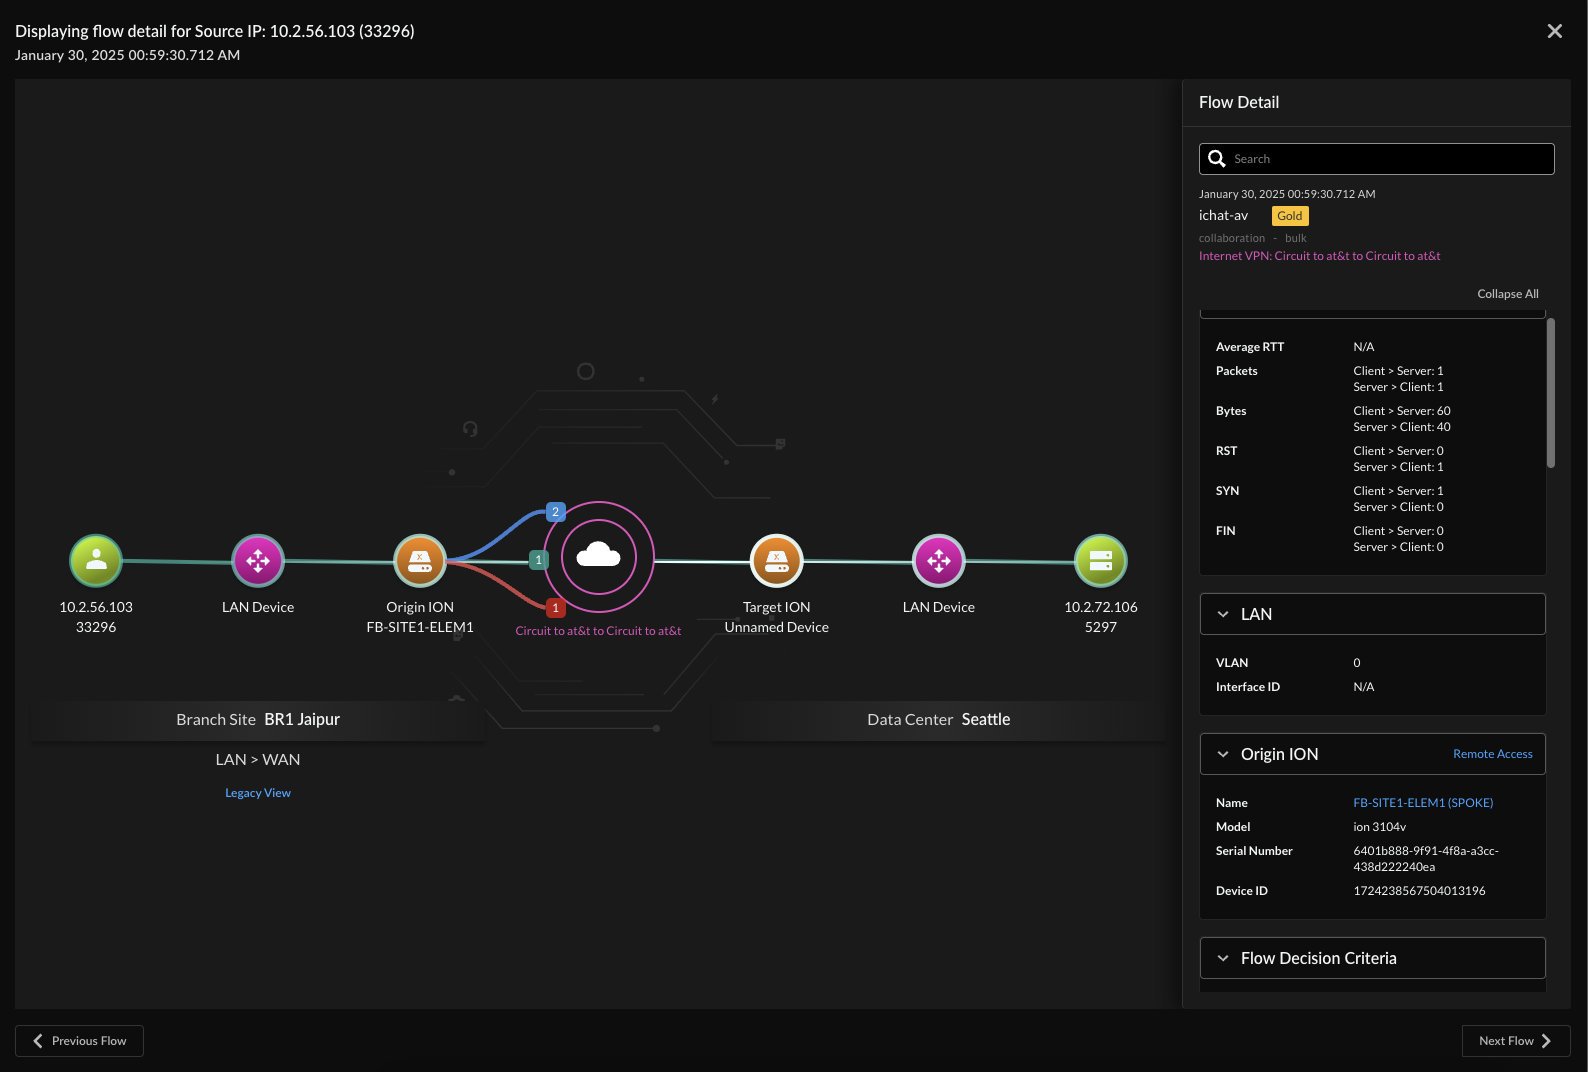
- Select MonitorFlows .The Flows chart displays the last 1000 flows ( (pagination with upto 1000 flows per page) for the selected time range, which can be up to one hour. You can filter flows for individual applications, devices, paths, and WANs. Sort the data by any of the columns displayed in the flow table.Click any flow to view comprehensive end-to-end flow sessions. Detailed information on the attributes of the flow enables you to visualize the entire path of a flow, from its origin site to its destination (target site), across multiple sites and network segments.
![]()
- On the right panel, displays Summary, LAN Device details, ION Device details, Policies applied or configured (Path, QoS, NAT, Performance, and Security), Application Assurance, and Performance and Statistics for the selected flow such as,
- Flow Decision Criteria or Bitmap to see the detailed decisions taken for a flow as it was processed.
- Source and Destination IP and Port.
- Application Name, category, information on the parent application and the transaction type.
- Path and Priority policy set-specific information, such as policy set, policy rule, source, destination prefix, network context, and the priority class. The Path and QoS policy rule name lets you navigate to the edit screen of that rule where you can view and edit the rule.
- Security information like the Security Policy rule applied, zone the flow originated and terminated in, and the action applied.
- Flow characteristics such as direction, start time, last activity time, and information on a new flow.
- TCP session metrics like SYN, RST, FIN, transaction-related metrics like SACK, OOO packets, and retransmit bytes and packets.
- Application Performance metrics like SRT and RTT.
- Flow displaying the numbers from origin ION to target ION indicates Selected Paths, Available Paths, and Excluded paths.
Displays the device-dependent information such as,- Link Health- Exports link health along with flow records. Exports min/max average for bytes/packets fields like RTT, RST, Fin, OOO, etc
- Device ID- Exports device ID (e.g., OS info) as it becomes available in the flow record.
- IoT Device ID & SNMP Info - Exports data collected by ION SNMP for IoT security crawling for topology visualization.
- SGT Visibility
The below table provides the detailed information on the attributes of the flow enables you to visualize the entire path of a flow, from its origin site to its destination (target site), across multiple sites and network segments.Colors Name of the Colors Indication ![]()
Speech Magenta VPN ![]()
Dogger Blue PrivateWAN ![]()
Boston Blue DirectInternet ![]()
Slate Blue PrivateVPN ![]()
Bahama Blue ServiceLink Click on the Legacy View under a flow to see the Flow Decision Data in a tabular format. The Flow Decision Data, in addition to Flow Decision Bitmap, provides detailed information on path evaluations made as the flow was processed.


