Enterprise DLP
Analyze the Data Risk Dashboard
Table of Contents
Expand All
|
Collapse All
Enterprise DLP Docs
Analyze the Data Risk Dashboard
Analyze the Data Risk Dashboard to understand risky behavior on your
network.
On May 7, 2025, Palo Alto Networks is introducing new Evidence Storage and Syslog Forwarding service IP
addresses to improve performance and expand availability for these services
globally.
You must allow these new service IP addresses on your network
to avoid disruptions for these services. Review the Enterprise DLP
Release Notes for more
information.
| Where Can I Use This? | What Do I Need? |
|---|---|
|
Or any of the following licenses that include the Enterprise DLP license
|
Analyze the Data Risk Dashboard to understand your overall data risk score and get an
assessment of your overall security posture. It helps you identify data security
hotspots where data risk may be high and needs priority attention. The Data Risk
Dashboard provides a granular Risk Breakdown that allows you to explore potential
data risks across your control points, applications, and data profiles. By default,
the Risk Breakdown displays the risks for what Enterprise DLP has calculated to
be your riskiest data asset exposures. However, you can modify and change the Risk
Breakdown as needed. The default Risk Breakdown display is restored when the page is
refreshed. The Data Risk Dashboard recalculates your data risk every 24 hours.
Additionally, actionable Recommendations are provided. These are contextual
recommendations made by Enterprise DLP based on your data risk model. The
recommendations are sorted and displayed based on the highest impact changes to your
security posture. These actionable recommendations address platform-wide changes you
can make rather to applications, data assets, or users rather than addressing an
individual data asset.
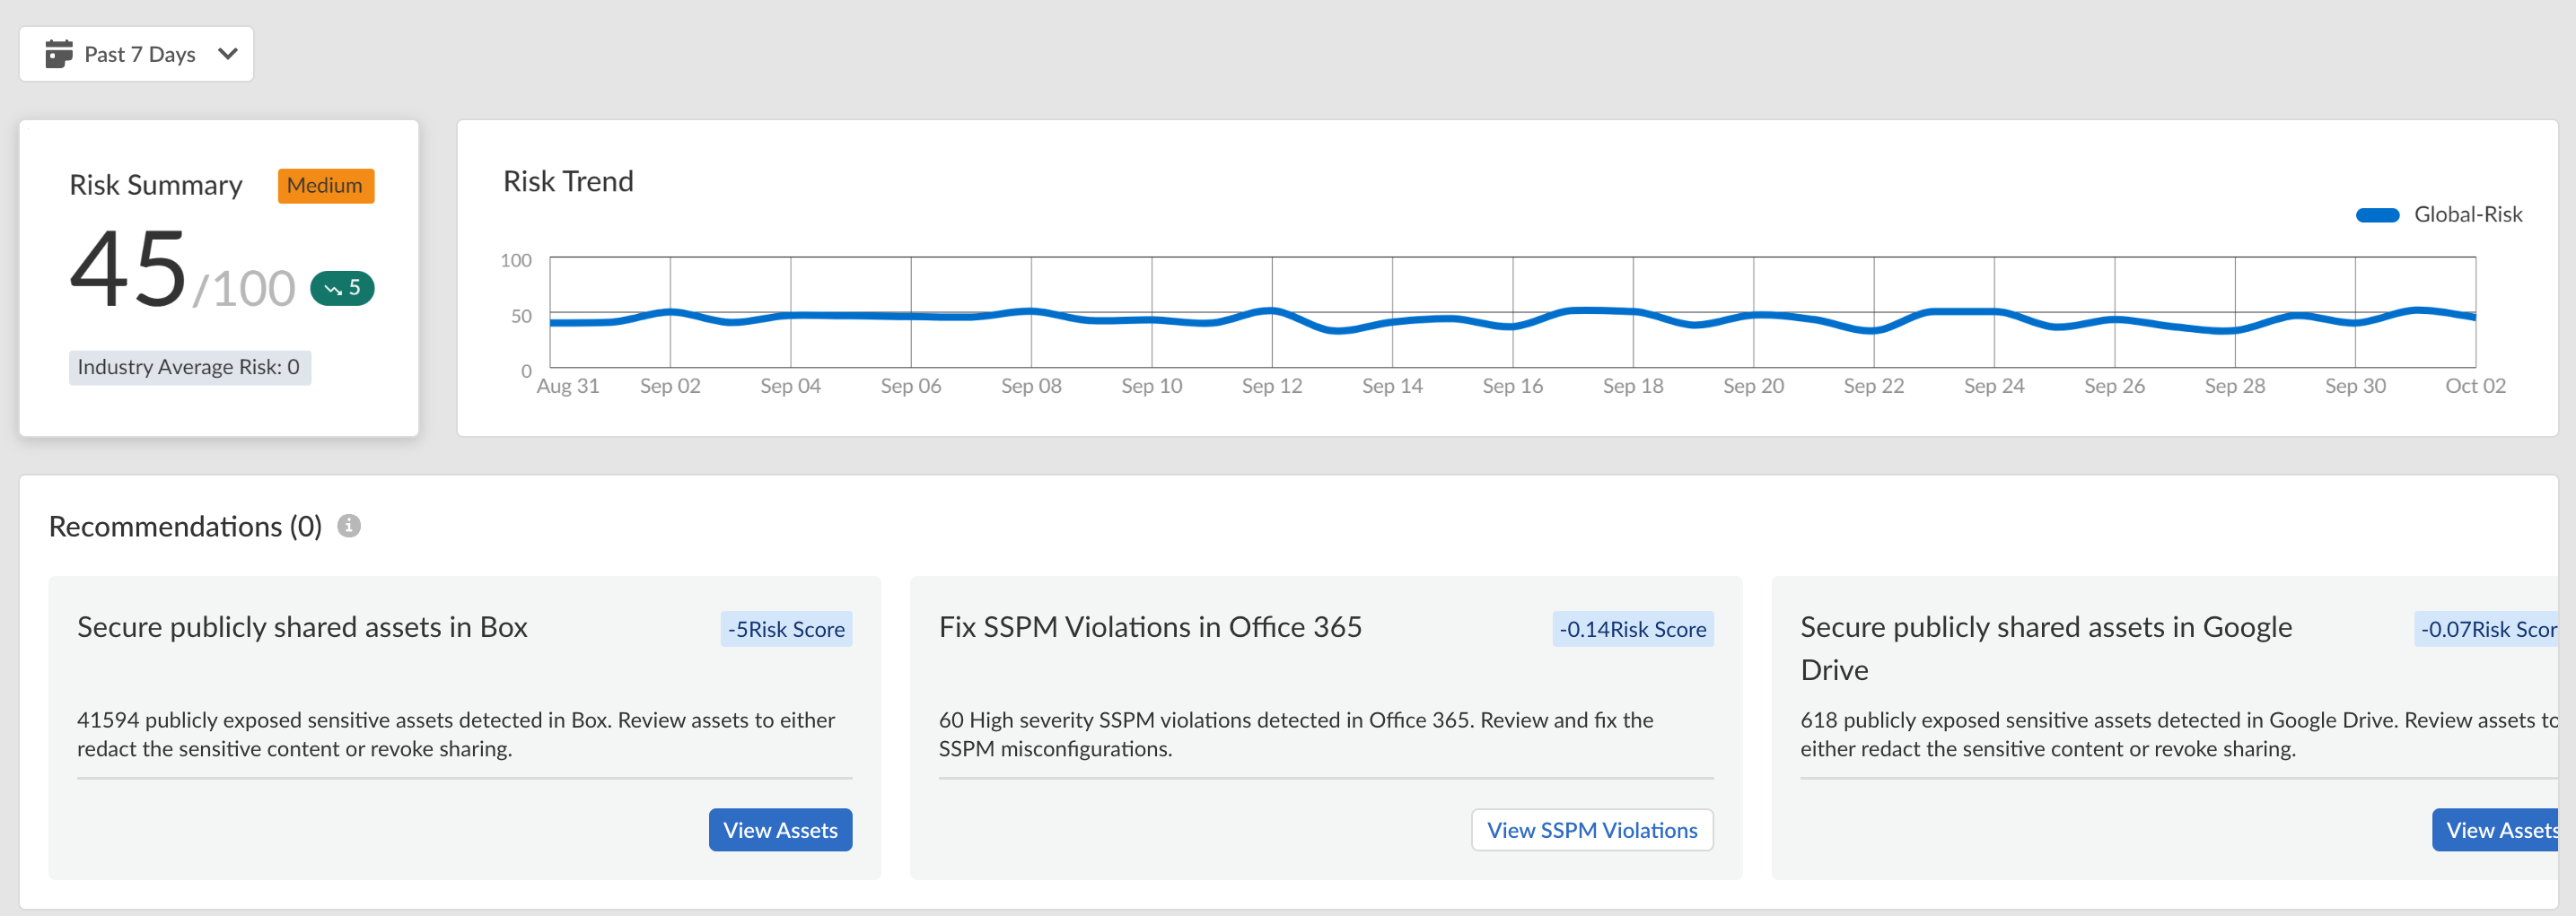
- Log in to Strata Cloud Manager.Select ConfigurationData Loss PreventionData Risk.Review the high-level summary for your data risk exposure.To begin, apply the time filter for which you want to review. You can select Past 7 Days (default), Past 30 Days, or Past 90 Days.
- Risk Summary —Your overall data risk score out of 100 across all your data profiles, instances, applications, and control points. Additionally, a widget displays whether your data risk score has improved or gotten worse over the specified time period.
- Risk Trend—Line graph to show you how your data security posture has improved or gotten worse over the specified period of time.
- Recommendations—Actionable security recommendations you can take to strengthen your security posture. Each recommendation allows you to:
- View App Details to understand which applications are impacted by the recommendation.
- View Assets to understand which files and file types are impacted by the recommendation.
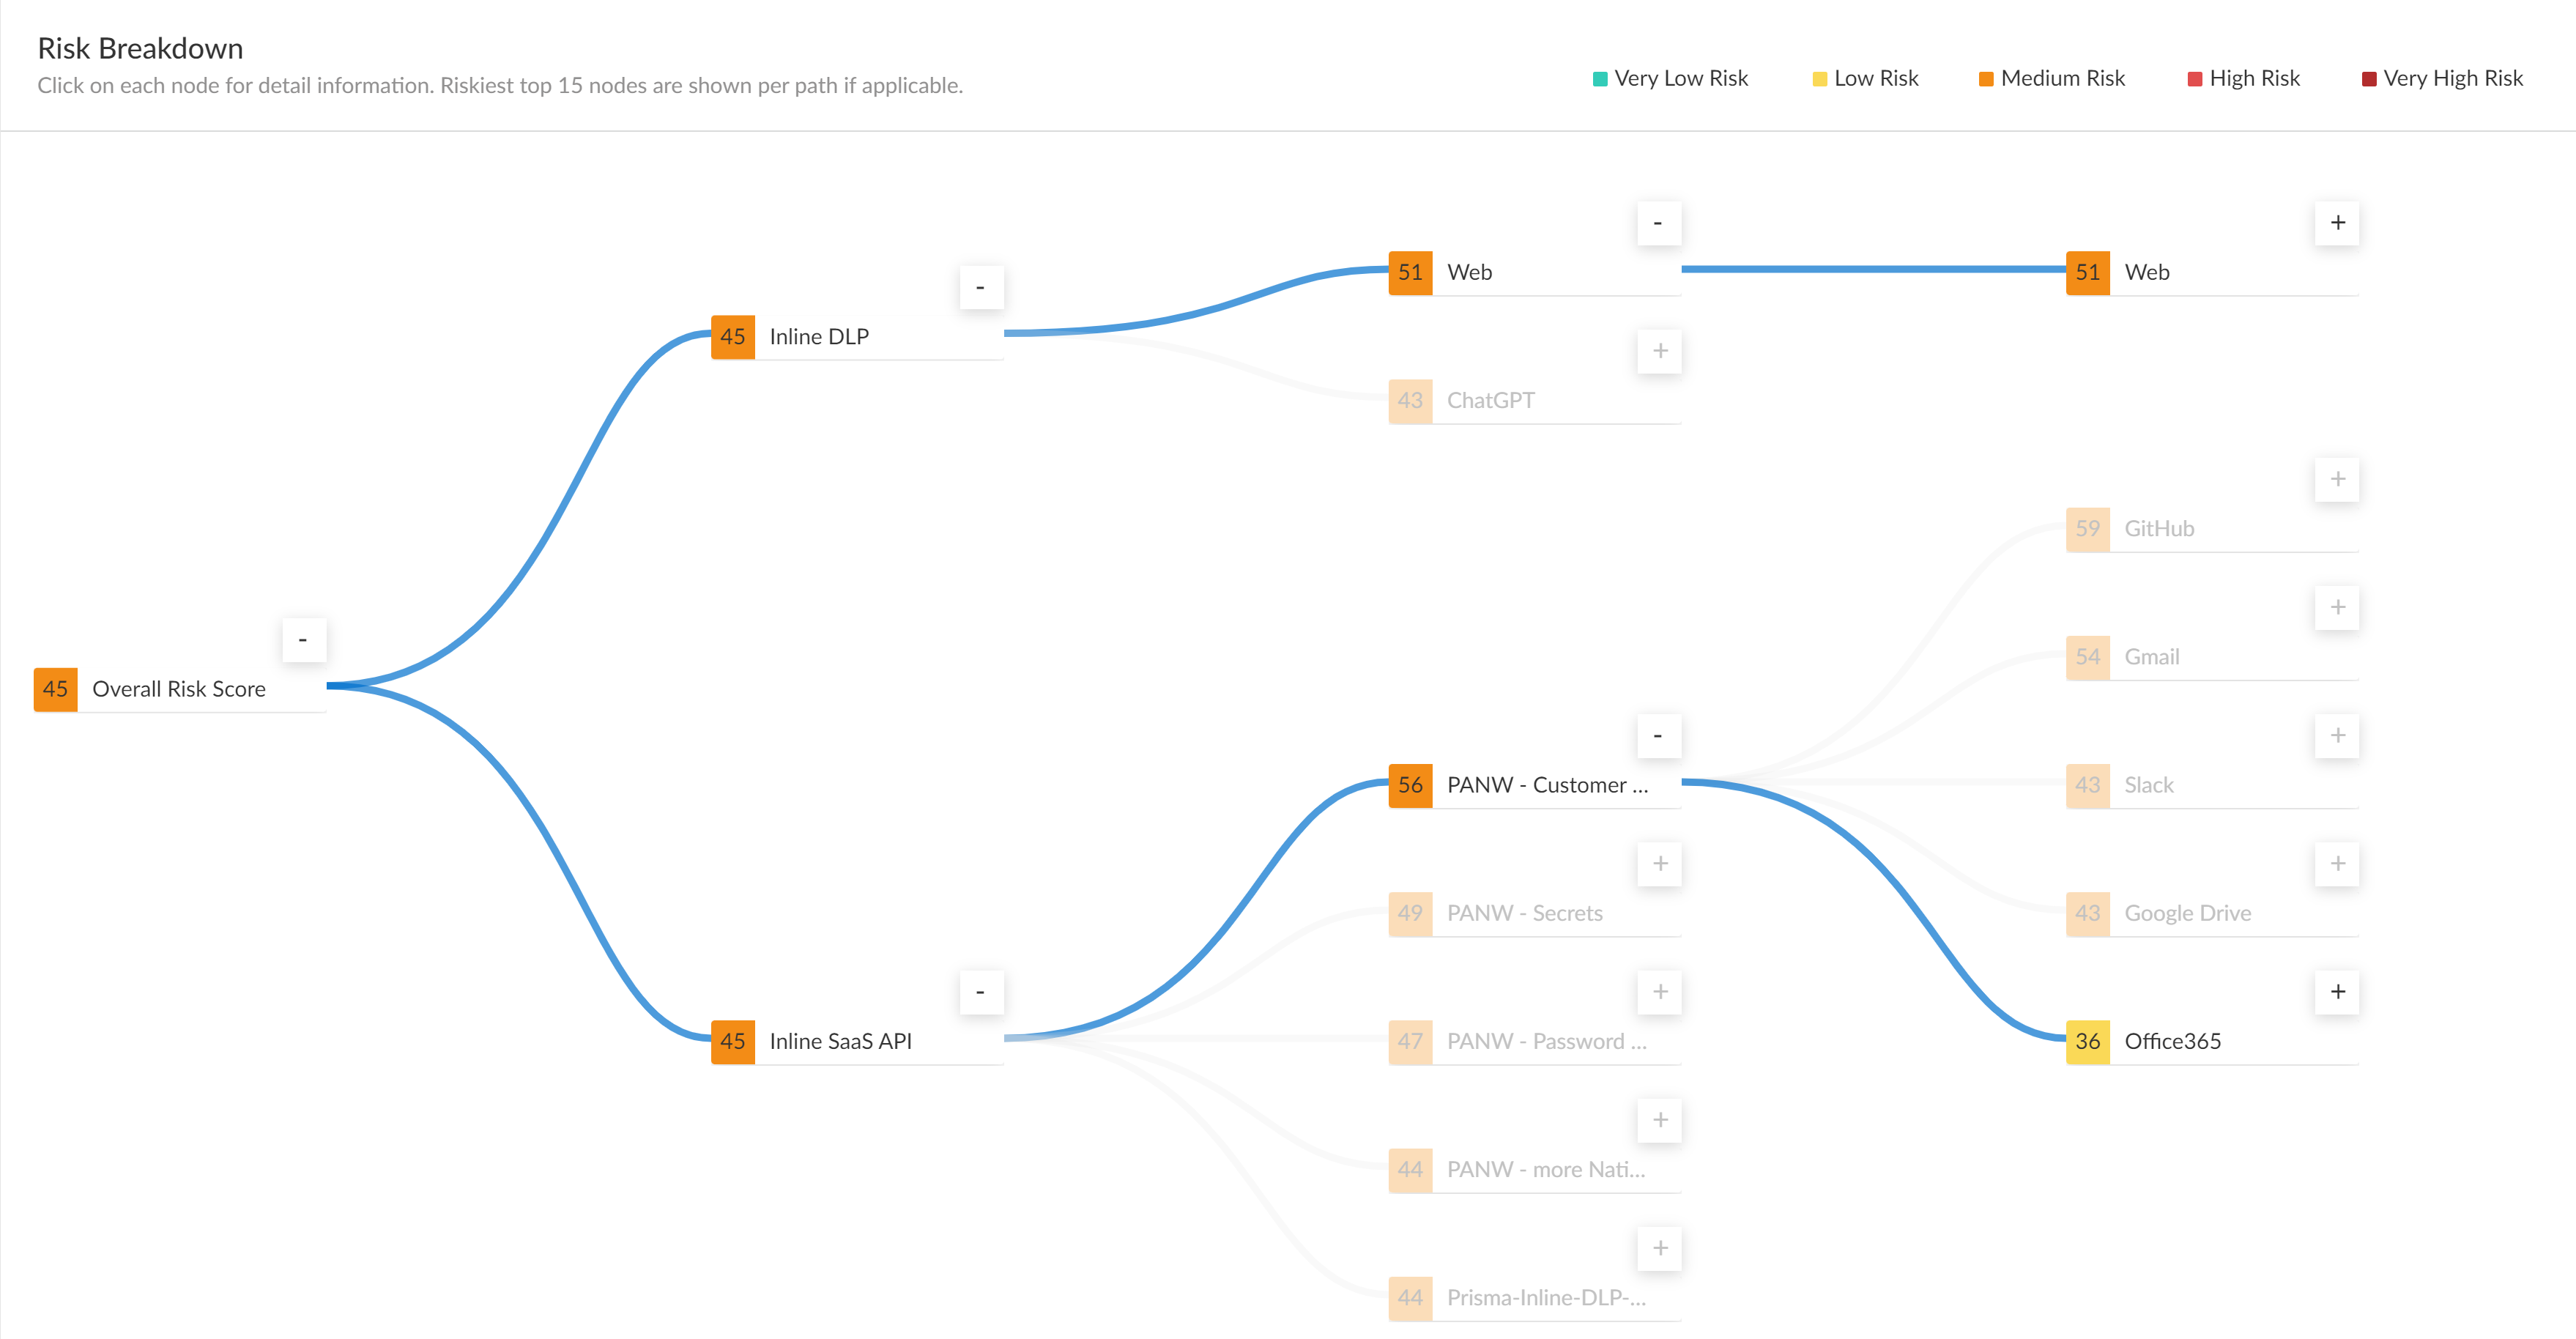
![]() Review the Risk Breakdown.The Risk Breakdown provides in-depth details about each node in your data security deployment. As each node is displayed, you can apply additional filters as needed. You can filter each node independent of one another to display to review the risk breakdown that is most important to you.
Review the Risk Breakdown.The Risk Breakdown provides in-depth details about each node in your data security deployment. As each node is displayed, you can apply additional filters as needed. You can filter each node independent of one another to display to review the risk breakdown that is most important to you.- Data Profiles—Enterprise DLP data profiles with traffic matches.
- Instances—Application instances for applications onboarded to SaaS Security.
- Applications—Applications onboarded to SaaS Security that has seen activity such as data profile matches, uploaded assets, or downloaded assets.
- Control Points—The security enforcement points where data security incidents have occurred.
![]() Click a specific data risk node to view detailed information for assets matching that group.
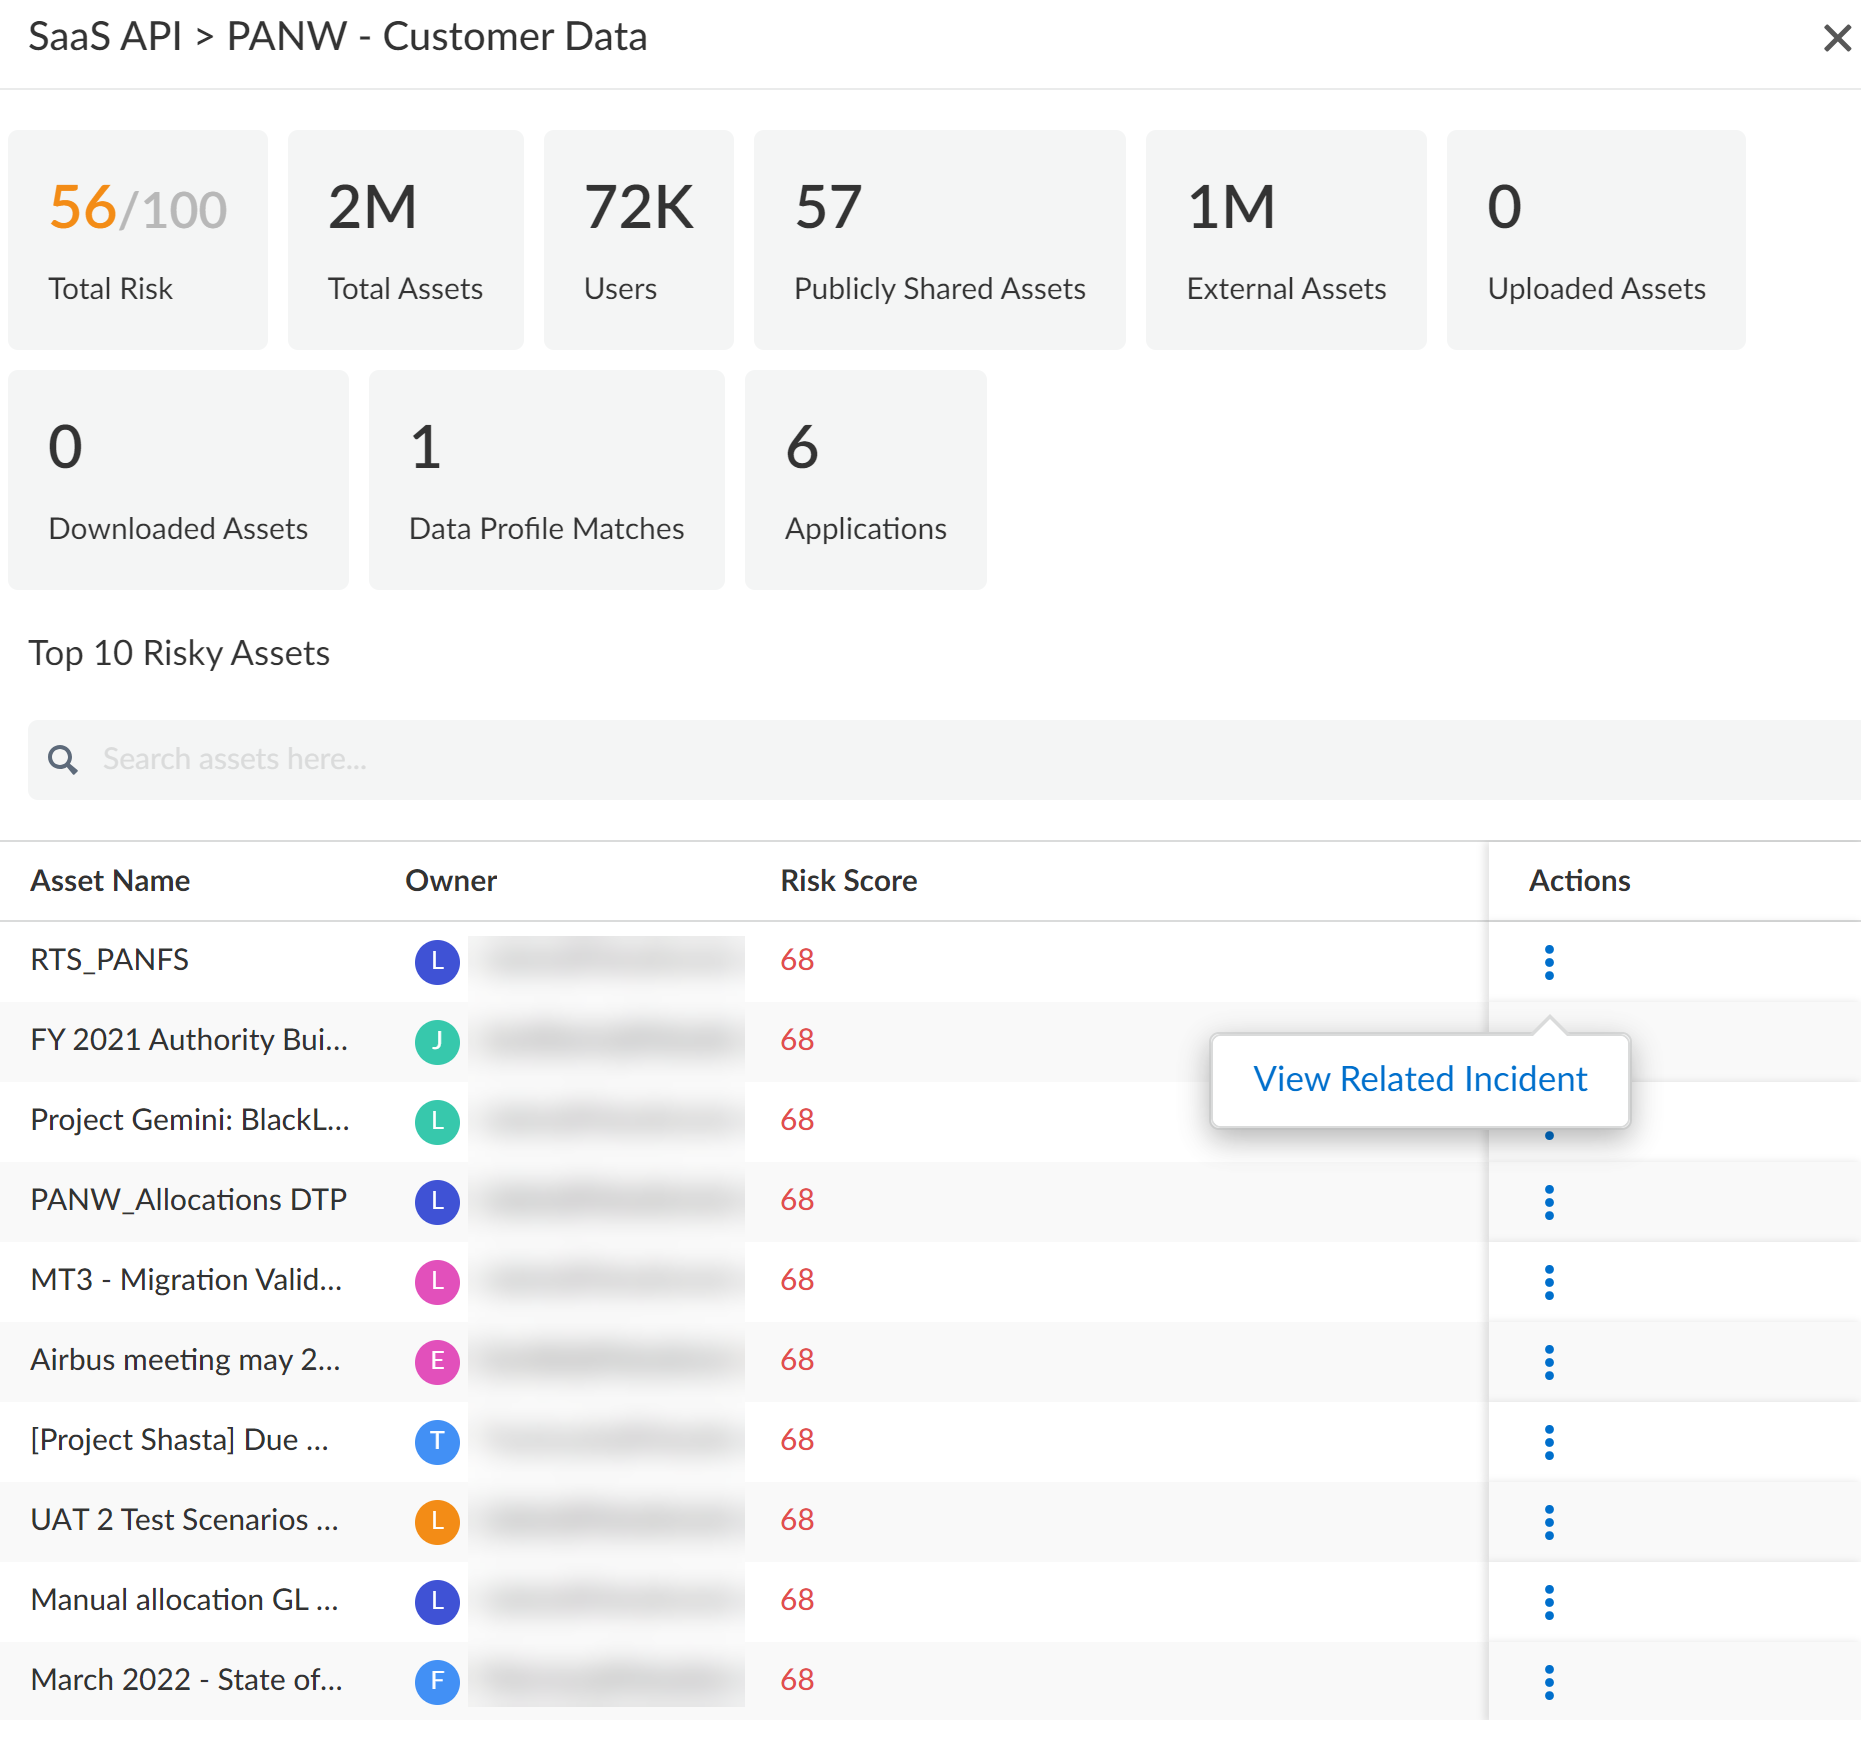
Click a specific data risk node to view detailed information for assets matching that group.- Total Risk—Average Data Risk for all assets matching that specific group.
- Total Assets—Total number of unique and sensitive data assets inspected.
- Users—Total number of unique users who have either owned, uploaded, or downloaded assets with sensitive data.
- Publicly Shared Assets—Data asset on a SaaS application that is publicly accessible by anybody with the public link.
- External Assets—Data asset created using your corporate domain that is shared with a specific user outside of your corporate domain.
- Uploaded Assets—Files uploaded to a SaaS application.
- Downloaded Assets—Files downloaded from a SaaS application.
- Applications—Total number of applications with inspected traffic that generated a data security risk.
- Top 10 Risky Assets—List of data assets sorted by Data Risk. The Asset Name, Owner, and Risk Score are displayed. Additionally, you can expand the Actions and View Asset or View Related Incident.
![]() View Related Incident to view more details about the specific DLP Incident.
View Related Incident to view more details about the specific DLP Incident.


