IoT Security
Navigate the IoT Security Portal
Table of Contents
Expand All
|
Collapse All
IoT Security Docs
Navigate the IoT Security Portal
The IoT Security portal is the web-based user interface for administrative access to
IoT Security configuration settings and IoT device data.
| Where Can I Use This? | What Do I Need? |
|---|---|
|
|
After you onboard IoT Security, activate
IoT Security licenses on your firewalls, and deploy them so that
they can feed data to the logging service, you’re ready to access
the IoT Security portal and begin using it. Log in with your account
credentials for the Palo Alto Networks Customer Service Portal.
IoT Security uses Single Sign-on (SSO) to verify your login.
The IoT Security portal fully supports Google Chrome and
partially supports Microsoft Edge, which means the portal is expected
to be usable but might not look exactly as designed. It does not
officially support Microsoft Internet Explorer, Apple Safari, or
any other type of browser.
The portal interface is grouped into several sections.
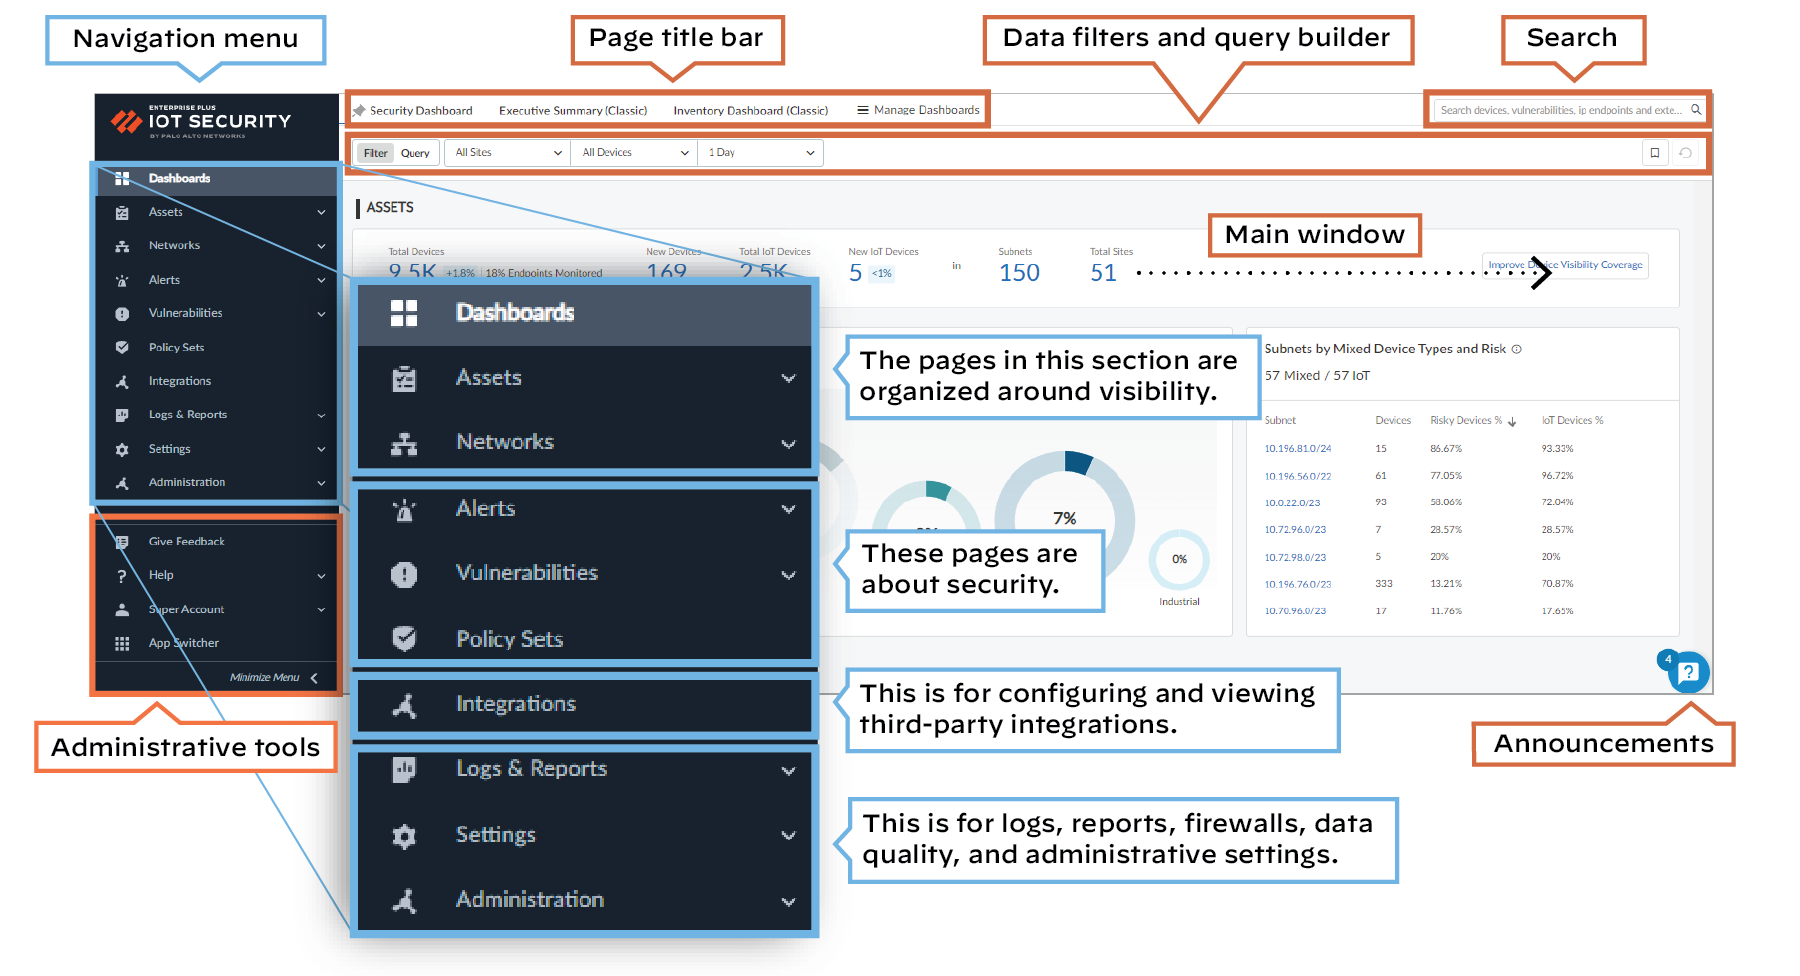
Navigation – The items in the left navigation menu are loosely grouped into four sections.
The first section is organized around visibility: Dashboard, Assets, and Networks. The
next section is security related: Alerts,
Vulnerabilities, and Policy Sets. The third section is where you configure and review
settings to integrate IoT Security with third-party products: Integrations. Finally, the last
section is where you can check logs, reports, firewalls, and data quality, and manage
administrative settings: Logs & Reports, Settings, and Administration.
Use the left navigation menu to navigate to different pages in
the IoT Security portal. When there are data filters at the top
of a page, use them to control the data that appears on the page
by site, device type, and time period.
Under the navigation menu is a set of administrative tools:
- Give feedback – Leave feedback for IoT Security developers.
- Help – Open the Customer Support Portal.
- User name (first and last name from the user’s contact information) – When you click the name, these options appear:
- Preferences – Modify your contact information, time zone, idle session timeout, alert sound (that is, control if an audible alert sounds whenever IoT Security detects new Security alerts), and SMS and email notification settings.
- Resource Center – See status notifications about firewall logs, and learn about IoT Security through recommended resources and useful links
- Dark Theme/Light Theme – Switch between dark and light UI display themes.
- Log out – Log out of your administrative session.
- App Switcher – Take a shortcut to other Palo Alto Networks applications through the hub.
Search – At the top of the page to the right of the page
title bar is a search field where you find data by entering keywords
to search for devices, alerts, vulnerabilities, and external destinations.
Data Filters – Below the page title bar and search field
on many pages is a set of filters that control the data that the IoT Security portal displays on each page. The filter system consists
of global filters and local, page-specific filters. Global filter
settings persist while you navigate among different pages with various
filters appearing as appropriate per page. For example, there's
no time filter on the Vulnerabilities page, there are additional
filters on the Devices and Security Alerts pages, and there are
no filters at all on the User Accounts page. Global filters have
default values but can also be customized. Modified and added filters
appear in the UI as blue instead of black, so you can easily tell
them apart from the default ones. If a page has a default local
filter, it appears among the other global filters at the top of
the page. For example, the Security Alerts page applies an Active
Alerts filter by default, so this local filter automatically appears
among the global filters whenever you open the Security Alerts page.
In addition, there are also page filters that are only applicable
to the data on a particular page. When you scroll down a page, both
the global and page filters continue to remain in view in the upper
right of the title bar.
Query Builder – Next to the data filters is the query
builder. Use it to find information about devices, alerts, and vulnerabilities
by constructing queries out of various components. A single query
can combine devices and security alerts or devices and vulnerabilities.
For example, you might query for all IoT devices from a particular
vendor that raised a particular alert, or you can query for all
IoT devices in a particular profile that have a specific vulnerability.
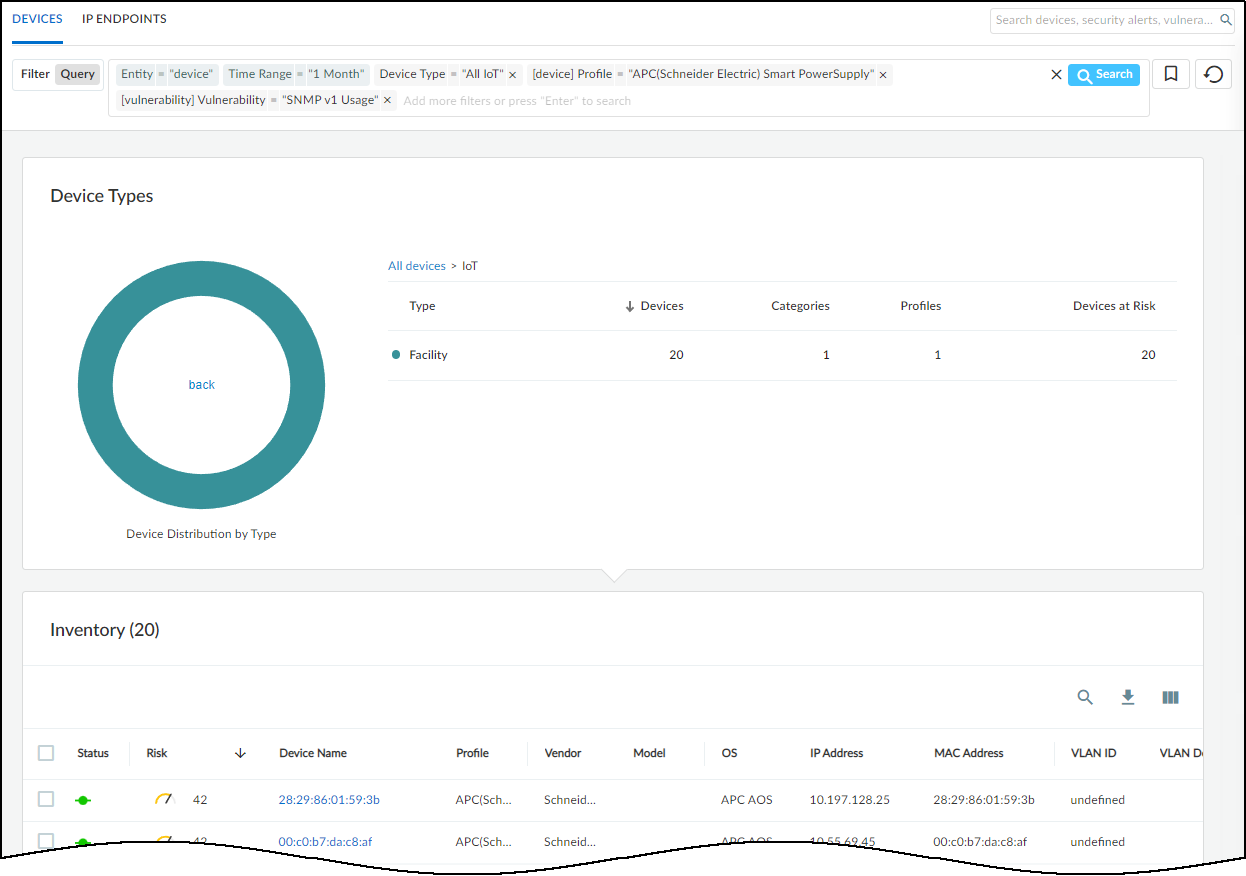
For example, this query shows if the devices in the device profile
for APC (Schneider Electric) Smart Power Supply support SNMPv1:
entity = device, Time Range = “month”, Device Type = “All IoT”, [device] Profile = “APC(Schneider Electric) Smart PowerSupply” [vulnerability] Vulnerability = “SNMPv1 Usage”
The results of the query show that 20 IoT devices support SNMPv1
and which ones they are.
The query tool uses the logic of “AND” between expressions using
the operators = (equals), != (doesn’t
equal), and IN (includes). For example,
the following query fetches data where Time Range = “week” AND Device Type = “All IoT” AND [vulnerability] Severity IN (“High”, “Critical”):
entity = device, Time Range = “week”, Device Type = “All IoT”, [vulnerability] Severity IN (“High”, “Critical”)

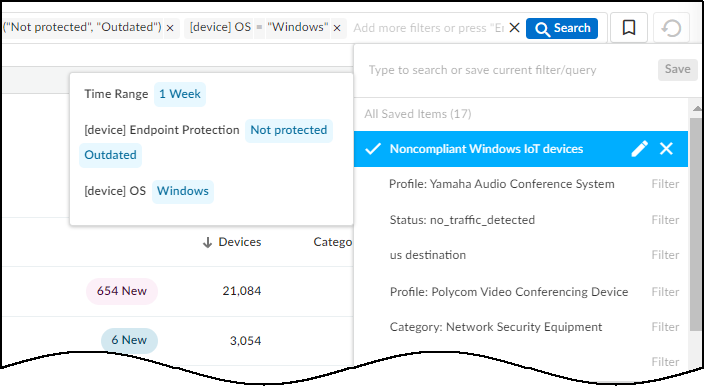
You can save queries so you don't have to recreate ones used
repeatedly. To save a query, click the ribbon bookmark icon to the right
of the Query field, and give it a name. For example, if you regularly
check the number of IoT devices running a Windows OS that were actively
on the network during the past week and that have no endpoint protection
or outdated protection, create this query and save it with a name
such as Noncompliant Windows IoT devices:
entity = device, Time Range = “week”, Device Type = “All IoT”, [device] Endpoint Protection IN (“Not protected”, “Outdated”), [device] OS = “Windows”

When you want to use the query again, just click the bookmark
icon and then click the name in the list of previously saved queries and
filters. You can also edit entries in this list and delete them.
You cannot save queries from any of the dashboards, such
as the Executive Summary.
The query tool has numerous parameters you can use to find whatever
nugget of data you want. For example, enter the following query
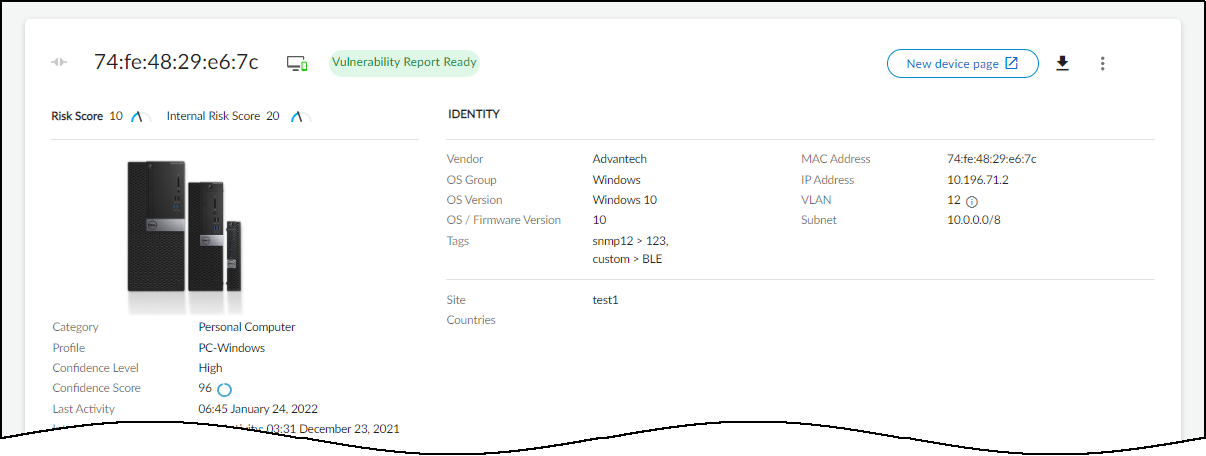
to check which devices were in a vulnerability scan report:
Entity = device, Time Range = “1 Year”, Device Type = “All IoT”, [scanReport] Scan Report = “yes”

By looking at the Device Details page of devices in the results
of the query and clicking Vulnerability Report Ready,
you can download the report as a PDF to your system where you can
keep and read it.
To help you get started using the query builder, IoT Security provides a collection of
example templates for common queries. Study these preconfigured queries to learn query
builder capabilities, use them as they are, or use them as models for building similar
queries of your own.
To see the preconfigured example queries, click Query
under the page title bar and then click the Query Bookmarks
icon.
The preconfigured templates differ somewhat based on the vertical theme that’s
active on your IoT Security portal. Each vertical theme has five example templates.
Here’s an example for each theme:
Enterprise IoT Security Plus
- Name: [Example] This Week’s Active Insecure-Login Alerts
- Query: Entity=”alert”, Time Range=”1 Week”, Alert Status=”Active Alerts”, Alert Type IN (“insecure login”, “unsecure login”, “Unsecure login”)
- Summary: This queries IoT Security for all active alerts related to insecure logins over the past week.
![]()
Industrial IoT Security
- Name: [Example] Critical Risk Internet Connected Industrial Devices
- Query: Entity="device", Time Range="1 Year", Device Type="Industrial", [device] Risk = "Critical", [device] Internet Access="yes"
- Summary: This queries IoT Security to show all industrial IoT devices that had a critical risk level and Internet access within the past year.
Medical IoT Security
- Name: [Example] Risky Internet Connected IoT Devices
- Query: Entity="device", Time Range="1 Year", Device Type="All IoT", [device] Risk IN ("High", "Critical"), [device] Internet Access="yes"
- Summary: This queries IoT Security to show all IoT devices that had a high or critical risk level and Internet access within the past year.
You can edit the expressions that constitute a query template and the template name,
perhaps saving a modified query with a new name to reuse later. You can also delete the
example templates.
Announcements – Toggle open and closed a vertical panel on the right side of the
UI with information about recent feature releases and important security
announcements.
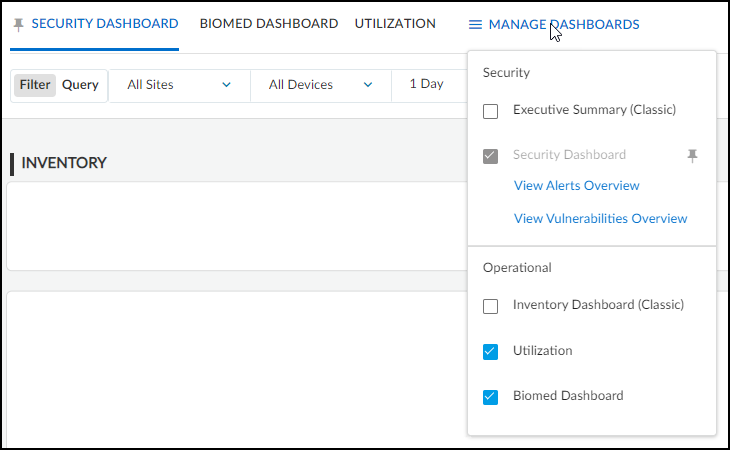
Manage dashboards – When your portal theme has multiple dashboards, such as
Medical IoT Security, you can control which one is the default, which ones are available
in adjacent tabs for quick access, and which ones are hidden. Recognizing that users of
the IoT Security portal function in different roles, IoT Security lets you set your own
preferences to best suit your needs and thereby increase efficiency and
productivity.
- To manage the display of the various dashboards, select DashboardsManage Dashboards.
- In the Manage Dashboards drop-down menu, select the check
boxes of dashboards you want to display as a tabbed dashboard for faster access.
Clear the check boxes of those you don’t want displayed as a tabbed dashboard.The left-to-right order of tabbed dashboards displayed in the main window corresponds to the top-to-bottom order of dashboards listed in the drop-down menu with the pinned (preferred) dashboard appearing on the far left.
![]()
- To set the default dashboard to display first when navigating to
Dashboards in the left navigation panel, click the
pushpin icon next to a dashboard name in the Manage
Dashboards drop-down menu.If you change the portal theme to a vertical that doesn’t include your pinned dashboard, the default dashboard for that vertical becomes the new pinned dashboard.
- To open a new browser tab or window showing security alerts and vulnerabilities, click View Alerts Overview and View Vulnerabilities Overview.


