Network Security
View the Tunnel Status (Strata Cloud Manager)
Table of Contents
Expand All
|
Collapse All
Network Security Docs
View the Tunnel Status (Strata Cloud Manager)
View the IPSec VPN Tunnel status of the firewalls in the Strata Cloud Manager.
- Log in to Strata Cloud Manager.Select ManageConfigurationNGFW and Prisma AccessDevice SettingsIPSec Tunnels and select Monitor.Select the Configuration Scope to view the IPSec VPN tunnel status. You can select a folder or firewall from your Folders to monitor the IPSec VPN tunnel that you created on the firewalls:
- To view the status of the IPSec tunnels on all the firewalls, select the All Firewalls folder.
- To view the status of the IPSec tunnels for the group of firewalls associated with a folder, select the specific folder.
- To view the status of the IPSec tunnels on a specific firewall, select the firewall.
- If you have created the VPN cluster using Auto VPN, then monitor those tunnels in the Auto VPN (ManageConfigurationNGFW and Prisma AccessGlobal SettingsAuto VPN) page.
- You can monitor only on-premises firewalls and not the components managed by Prisma Access.
- Monitoring is disabled at the Global and snippet level. Therefore, you can create an IPSec tunnel in the global or snippet configuration scope, but you can monitor the IPSec tunnel only in the folder or firewall level.
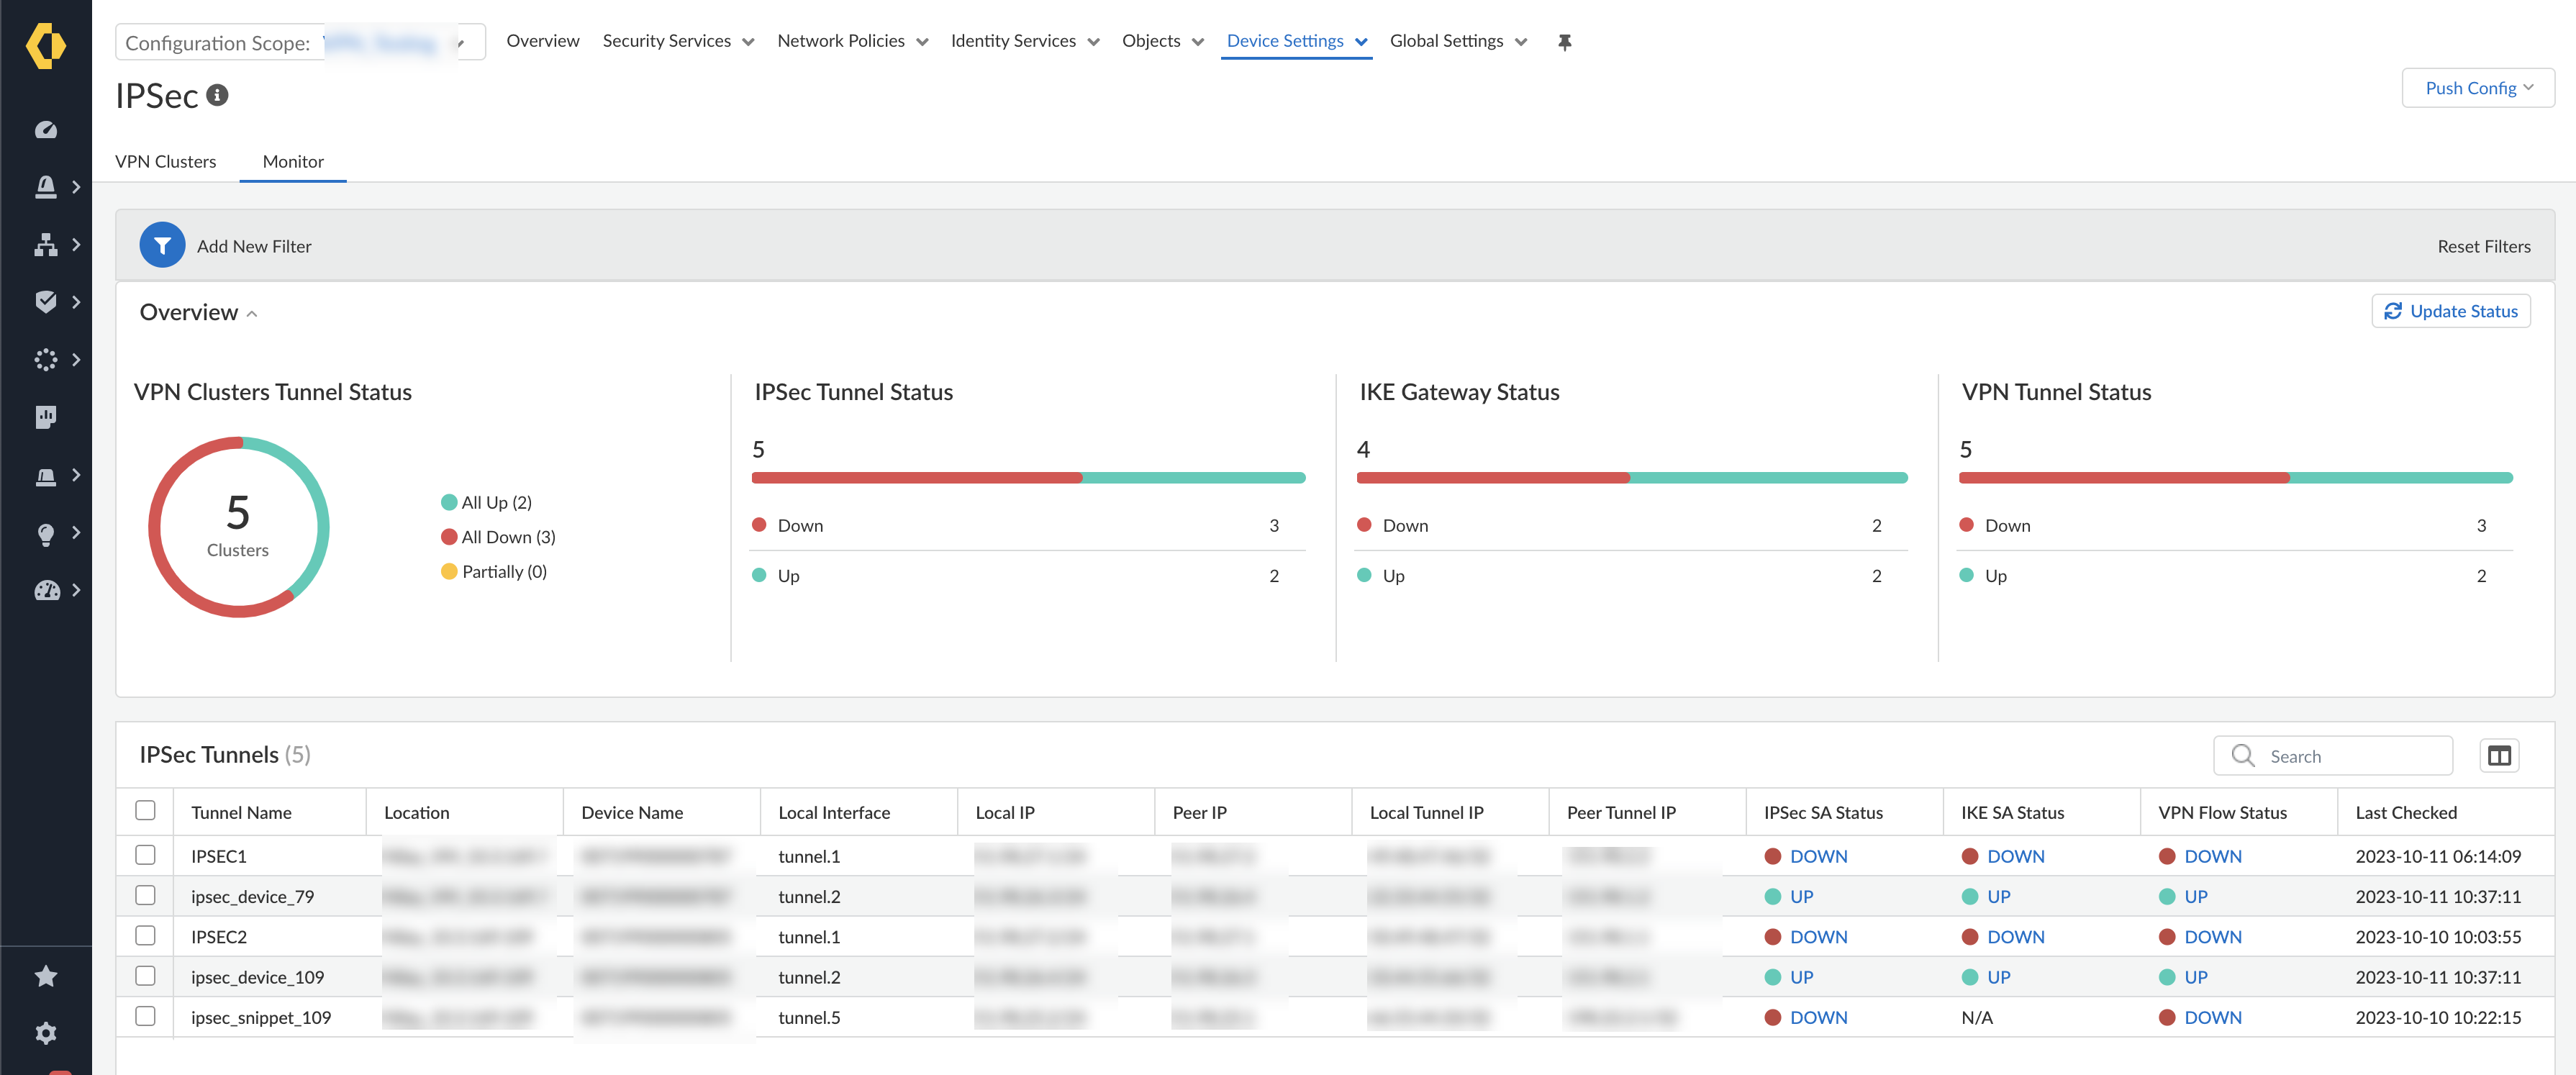
![]() View the VPN Cluster Tunnel Status that provides the graphical representation of the number of tunnels that are up, the number of tunnels that are down, and the number of tunnels that are partially up.View the IPSec SA Status in IPSec Tunnels.
View the VPN Cluster Tunnel Status that provides the graphical representation of the number of tunnels that are up, the number of tunnels that are down, and the number of tunnels that are partially up.View the IPSec SA Status in IPSec Tunnels.- Green (UP) indicates a valid IPSec SA tunnel. Select UP to view detailed information about the IPSec tunnel.
- Red (DOWN) indicates that IPSec SA isn’t available or has expired. Select DOWN to view the detailed information to interpret the reason for failure.
View the IKE SA Status in IPSec Tunnels.- Green (UP) indicates a valid IKE phase-1 SA. Select UP to view detailed information about the IKE gateway.
- Red (DOWN) indicates that IKE phase-1 SA isn’t available or has expired. Select DOWN to view the detailed information to interpret the reason for failure.
View the VPN Flow Status for VPN traffic flow information in IPSec Tunnels.- Green (UP) indicates that the IPSec tunnel is up. Select UP to view detailed information about the VPN traffic flow.
- Red (DOWN) indicates that the IPSec tunnel is down. Select DOWN to view the detailed information to interpret the reason for failure.
Select Add New Filter, and select the field to view the results based on the selected field. For example, Add New Filter by selecting the Device Name from the list, to view the IPSec tunnel status for the selected device.![]() Select Reset Filtersto remove one or more filters.
Select Reset Filtersto remove one or more filters.![]() Select Update Status to update all the IPSec tunnel monitoring data present at that level (firewall, folder, or all firewalls).
Select Update Status to update all the IPSec tunnel monitoring data present at that level (firewall, folder, or all firewalls).


