Manage Prisma Access Locations
Table of Contents
Manage Prisma Access Locations
The Prisma Access Locations dashboard provides an overview of the health and
status of your remote networks, mobile users, and service connections.
The Prisma Access Locations dashboard gives you an
overview of the health of all your Prisma Access locations for your remote networks
and mobile users.

View the Health of Your Prisma Access Locations
The Prisma Access Locations tab gives you an overview of the
health of all your Prisma Access locations for your remote networks and mobile
users. The graphs show you the status of all your remote networks, service
connections, GlobalProtect mobile users, and Explicit Proxy mobile users. The graphs
are color-coded to represent the number of networks that are up (green), down (red),
unknown (gray), or have warnings that need your attention (yellow). The bar graphs
in each widget shows the top five Prisma Access locations for remote networks,
service connections, GlobalProtect mobile users, and Explicit Proxy mobile users,
based on the total bandwidth consumed during the selected Time Range. The
following example shows Prisma Access locations for GlobalProtect mobile
users.

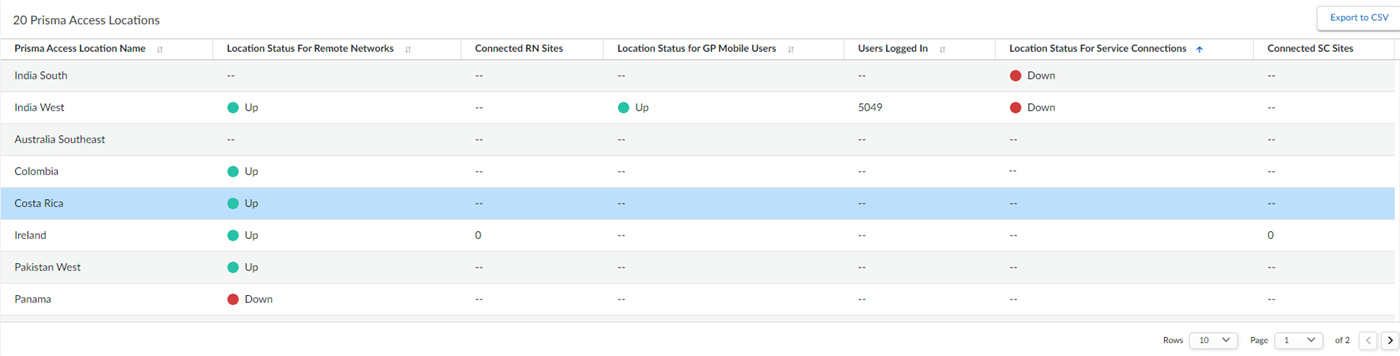
Prisma Access Locations Status
View the Prisma Access Locations status in real time. This table
shows the number of connected Remote Network sites, connected Service Connection
sites, and unique users logged in to Prisma Access in real time. The Prisma Access
Insights user interface displays up to 10,000 records in a table. If
you have more than 10,000 records, you can view them by exporting the table into
a CSV format by selecting Export CSV. Any filters that you might have
applied to the data in the table are also applied to the data that is being
exported to the CSV format. The columns that do not have data in them do not get
exported and are omitted in the exported CSV file.
The Location Status for GP Mobile Users and the Location Status for EP Mobile Users
are displayed depending upon your Connect Method selection. The Users
Logged In column displays an aggregation of both Explicit Proxy and
GlobalProtect connected users. Within a specific location, if a user logs in
from multiple hosts, the user is counted as a single user, but if any user logs
in from two different Prisma Access locations by disconnecting from one and
logging in from another within the time period, the user is counted as two
users.
Manage Prisma Access Locations Strata Logging Service Connectivity
The Strata Logging Service Connectivity tab gives you visibility into the Strata Logging Service connectivity health status from all your Prisma Access instances for the Strata Logging Service region that
you selected during your Prisma Access license activation. It helps you
determine if firewalls have disconnected from Strata Logging Service and
firewall logs are no longer being obtained. Each tenant can connect to only one
Strata Logging Service in any region of its choice. Insights polls
the Strata Logging Service database every five minutes to check for
connectivity between the nodes (Mobile Users, Remote Networks, and Service
Connections) and the Strata Logging Service database.
Remote Networks, GlobalProtect Mobile Users, and Service Connections
Information about Remote Networks, GlobalProtect
Mobile Users, and Service Connections display data in
real time.
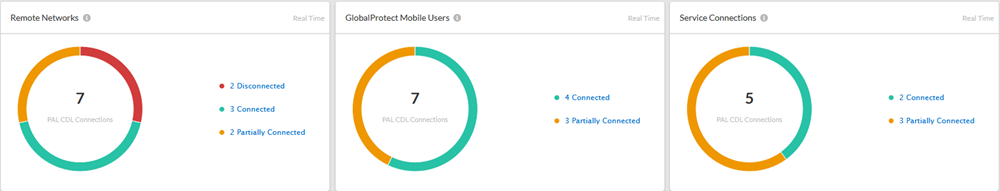
The widgets display the overall connectivity status from each node type (Remote Networks, Service
Connections, and Mobile Users) to Strata Logging Service. The number
displayed in each ring chart represents the total number of Prisma AccessLocations from where the nodes connect to Strata Logging Service.
Each location could further have one or more firewalls in it. The status of the
connections are shown in real time. The Time Range filter
does not apply to these widgets. The chart is color-coded based on how many
remote sites, mobile users, or service connections are currently in the
following status:
- Connected: All firewalls in the region are connected to Strata Logging Service.
- Disconnected: All firewalls in a region are disconnected from the Strata Logging Service.
- Partially Connected: One or more firewalls in the region are disconnected from the Strata Logging Service.
Prisma Access Location Strata Logging Service Connections
Prisma Access Location Strata Logging Service
Connections is a tabular representation of all the Prisma Access Locations and shows the status of each node type per location.
Each location can have one or more node types associated with it. Hence, the sum
of all the locations in the three ring charts may not necessarily tally with the
number of Prisma Access Locations displayed in this table. This is because a
location is represented only once in the table, regardless of whether it is
counted in all three ring charts or only one or two ring charts.
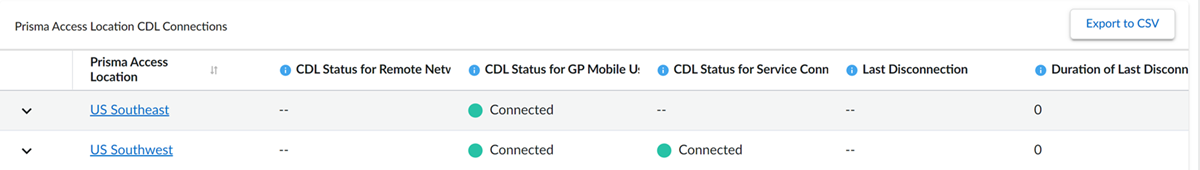
The table displays the Strata Logging Service connectivity status for each
Prisma Access Location. Click on the
down arrow next to a location to see the Total
Disconnections chart open beneath the row. Use the
Time Range filter to see the data in the chart for a
specific time range. Disconnections are counted by the number of times firewall
instances at that location got disconnected. For example, if a node or firewall
was disconnected, then connected and disconnected again, the number of
disconnections would be counted as two. If you would like to see the specific
node type in the location that was disconnected, you can select the
Prisma Access Location name to view the
details page for that location, then select the Node Type
to filter the data by the selected node type.
The Last Disconnection column shows when
the last time was that any node type (Mobile User, Service Connections,
or Remote Networks) in the location was disconnected, even though
it has been reconnected since then. It displays the latest outage
that has since been recovered. If a node type is currently disconnected,
the current disconnection data does not appear in this column.
The Duration of Last Disconnection column shows the duration of the
disconnection starting from the second the Strata Logging Service
connection was lost to the second the connection was recovered. This allows you
to see the full duration of the disconnection.
Select a Prisma Access Location name to open the Strata Logging Service Region details page for the location.
Total Disconnections displays an aggregate of all disconnections for all
nodes types in the selected location during the time period selected in the
Time Range. To filter the data for only one node
type, select the Node Type. This widget shows you for how
long the connections from this region to Strata Logging Service were
lost. The peaks in the graph indicate that there were one or more disconnections
at the time indicated by the X-axis.
Select a point on the Total Disconnections trend
line to filter the data displayed in the Disconnection
Durations chart to show the connection status for the
next five minutes, starting from the time point that you clicked.
It also displays the Disconnection Durations for the selected
Time Range. The Disconnection
Durations widget displays the disconnection duration(s) that
each node experienced during the Time Range that you
selected. Each row represents a single node (firewall instance) and is
color-coded based on the node type (Remote Networks, Mobile Users, or Service
Connections). For example, if there are three remote sites experiencing
disconnections, you see three rows with the same color lines. Each row
represents a unique Strata Logging Service connection. Only the
nodes that have experienced disconnections are shown.