Strata Cloud Manager
Prisma SD-WAN Dashboard: Predictive Analytics
Table of Contents
Prisma SD-WAN Dashboard: Predictive Analytics
View the health of sites and applications in Prisma SD-WAN.
| Where Can I Use This? | What Do I Need? |
|---|---|
|
The other licenses and prerequisites needed for visibility
are:
→ The features and capabilities available to you in Strata Cloud Manager depend on which license(s) you are
using.
|
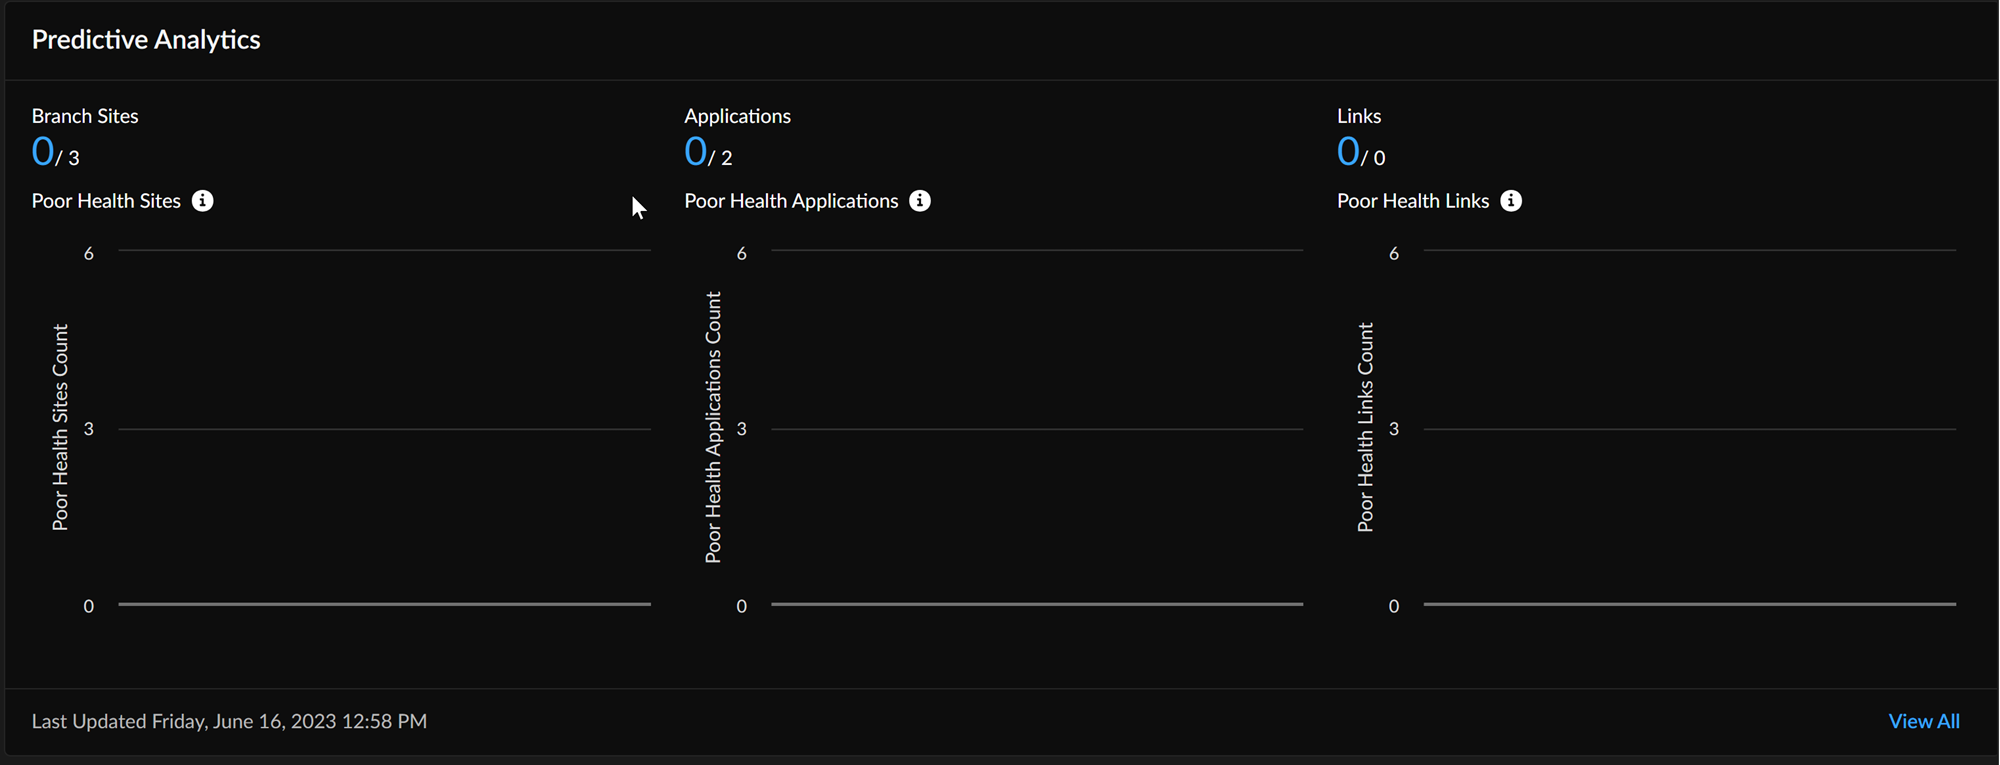
The Predictive Analytics widget provides
insight into the health of sites and applications and proactive monitoring to identify
critical issues and troubleshoot them faster, thus enhancing service levels. It
identifies critical sites, links, and applications and categorizes them as
Good, Fair, and
Poor at the tenant level, based on the AI/ML health scores.
The widget includes predicting capacity utilization at the branch site level based on
the previous three to six months of information.
The default time range to view the metrics is three hours; however, you can adjust it to
shorter or longer periods depending on the desired scope of information. Gain insights
into the top 10 sites whose bandwidth utilization increased in the previous 28 days; you
can view seven days prediction whenever 28 days prediction is unavailable and predict
the future branch capacity utilization.
Click View All to gain insights on Branch Sites, Applications,
Links, Network Insights, Top Sites with Traffic Volume Growth in Past 30 days, and Site
Capacity Prediction And Anomaly.