Autonomous DEM
Manage Queries from the Query Results Page
Table of Contents
Expand All
|
Collapse All
Autonomous DEM Docs
-
-
- AI-Powered ADEM
- Autonomous DEM for China
-
-
Manage Queries from the Query Results Page
View the overall status and details about all queries about your SASE
environment.
| Where Can I Use This? | What Do I Need? |
|---|---|
|
|
From the Query Results page,
you can see the overall status and details about all queries about
your SASE environment.
To view any detailed query results,
select a Query Name from the Query
Log to view a detailed analysis of a specific query.
- Result—From Result, you can see whether or results for your query are successful. If query results are successful, the word Yes appears in a green circle, with a statement confirming the query succeeded. If query results are unsuccessful, the verdict shows No in a red circle, with the reason why the query did not succeed. Information under Checks describes the checks performed on this query and their results.
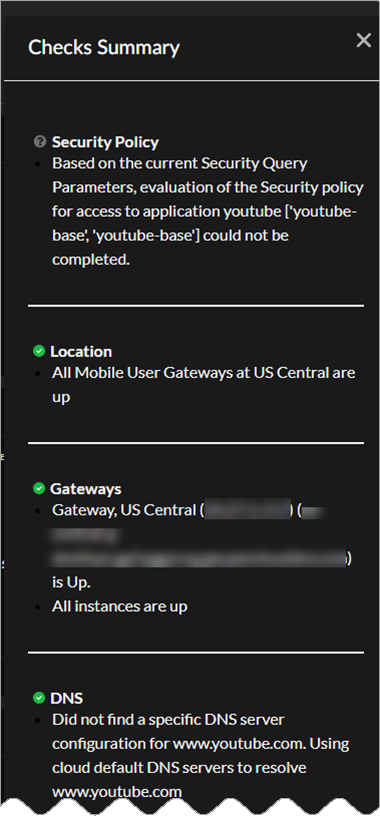
![]() Checks and Checks Summary—Select Checks Summary to see status of the checks performed in the query. Select View Relevant Incidents to go to the Incidents List for Incident details.
Checks and Checks Summary—Select Checks Summary to see status of the checks performed in the query. Select View Relevant Incidents to go to the Incidents List for Incident details.![]() Query Parameters—From Query Parameters, you can see the parameters you used and the system populated to create the query.
Query Parameters—From Query Parameters, you can see the parameters you used and the system populated to create the query.![]() Traffic Topology—View the Traffic Topology for the query.
Traffic Topology—View the Traffic Topology for the query.![]() Commits show the total number of commits made in the last half hour, as well as the most recent commit. Select any time along the timeline to see details about when the last commit occurred and whether the query was a success or failure. In addition to saying whether a commit was a success or a failure, a green dot shows a successful query, and a red dot shows a failed query.Authentication Server shows the authentication server’s IP address, response time, and its status.
Commits show the total number of commits made in the last half hour, as well as the most recent commit. Select any time along the timeline to see details about when the last commit occurred and whether the query was a success or failure. In addition to saying whether a commit was a success or a failure, a green dot shows a successful query, and a red dot shows a failed query.Authentication Server shows the authentication server’s IP address, response time, and its status.- IP address—An icon appears next to the address denoting the authentication server status. For example, if the address is Unreachable, a red x shows next to the IP address.
- Response time—The Response Time histogram shows the authentication server’s response time, in milliseconds, for the last half hour.
- Status—The authentication server status can be Reachable and Healthy (shown by a green line), Reachable and Degraded (orange line), Unreachable (red line), or No Data.
![]() DNS Server shows the information about the DNS server or servers, including IP address, response time, and its status. Select each DNS server address to see details.
DNS Server shows the information about the DNS server or servers, including IP address, response time, and its status. Select each DNS server address to see details.- IP address—An icon appears next to each DNS server’s address denoting its status. For example, if the address is Unreachable, a red x shows next to the IP address.
- Response time—The Response Time histogram shows the DNS server’s response time, in milliseconds, for the last half hour.
- Status—The DNS server status can be Reachable and Healthy (shown by a green line), Reachable and Degraded (orange line), Unreachable (red line), or No Data.
Application shows the information about the application, including response time and its status.- Response time—The Response Time histogram shows the application’s response time, in milliseconds, for the last half hour.
- Status—The DNS server status can be Reachable and Healthy (shown by a green line), Reachable and Degraded (orange line), Unreachable (red line), or No Data..
![]() Prisma Access shows the available Prisma Access Locations. The one used in the query has a green checkmark next to it, showing that it is Reachable and Healthy.
Prisma Access shows the available Prisma Access Locations. The one used in the query has a green checkmark next to it, showing that it is Reachable and Healthy.![]() Layer 3 Forwarding shows information about the application and Prisma Access Location, such as Destination IP/ Subnet and Next Hop.
Layer 3 Forwarding shows information about the application and Prisma Access Location, such as Destination IP/ Subnet and Next Hop.![]() Access Analyzer calls the Security Policy analysis library to get policy data for the query.
Access Analyzer calls the Security Policy analysis library to get policy data for the query.![]()


