Autonomous DEM
Known Issues—Autonomous DEM
Table of Contents
Expand All
|
Collapse All
Autonomous DEM Docs
-
-
- AI-Powered ADEM
- Autonomous DEM for China
-
-
Known Issues—Autonomous DEM
Review the open issues in Autonomous Digital Experience
Management (ADEM).
| Where Can I Use This? | What Do I Need? |
|---|---|
|
|
Here are the issues we’re currently working on.
Autonomous DEM Agent 5.10
| ID | Description |
|---|---|
| DEM-12373 | On the Access Experience page, agents with versions below 5.0 incorrectly show a status of Scheduled instead of Manual Upgrade when Canary Upgrade is configured; as agent below 5.0 are not eligible for Canary Upgrade. |
| DEM-12771 | New users registering after the Canary period incorrectly default to No Upgrades Planned instead of automatically moving to the Scheduled state for global upgrades. |
Autonomous DEM Agent 5.9
| ID | Description |
|---|---|
| DEM-12332 | When you enable the Application Security feature, the path visualization sometimes displays incorrect hop data for specific time intervals. |
| DEM-12280 | ADEM metrics and applications fail to appear on the Insights > Activity Insights > Users > Experience page when Application Security is enabled for TCP-based tests on non web or web applications with Curl disabled. |
Autonomous DEM Agent 5.7
| ID | Description |
|---|---|
| DEM-10992 |
ADEM 5.7.x agent is compatible only with GlobalProtect 6.3.3 when
the direct local network access is blocked in the GlobalProtect
app. With blocked access to the local network, if you install
ADEM 5.7.x agent in GlobalProtect 6.3.2 or below, GlobalProtect
downgrades and breaks the ADEM agent.
Workaround: To fix the issue, upgrade GlobalProtect to
version 6.3.3 and manually reinstall the ADEM 5.7.x agent. Hence
it is recommended not to install ADEM 5.7.x agent in
GlobalProtect 6.3.2 and below if you want to collect LAN metrics
when local network access is blocked.
|
| DEM-11093 | In the Path visualization widget, the GlobalProtect device icon incorrectly shows an empty connected state for Proxy-only mode, whereas the expected state is Disconnected. |
| DEM-7293 | When using macOS version Sonoma 14.5 with ADEM agent version 5.0.15, the Access Experience page shows the connected SSID appears as <redacted> instead of the actual SSID name. |
| DEM-2596 | When you have 200K ADEM agents or more,
the Settings page in ADEM fails to load. This is an
intermittent issue and is typically observed when multiple users
are trying to access the Summary page in
parallel. Workaround: Refresh the page or try
re-logging into ADEM. |
| DEM-2048 |
When performing a new installation of GlobalProtect 5.2.10 or
later on an M1 MacBook device that does not have Rosetta 2
installed, the Autonomous DEM agent does not get installed even
though the message that GlobalProtect displays indicates that
the agent installed successfully.
Workaround: Manually install Rosetta 2 on the M1 MacBook
device and then refresh the GlobalProtect connection to enable
GlobalProtect to re-initiate the install of the Autonomous DEM
agent.
|
Autonomous DEM Agent 5.6
| ID | Description |
|---|---|
| DEM-10630 | The enable/disable functionality of Browser-based Real User Monitoring (RUM) does not work as expected for Prisma Access Browser. |
| DEM-10499 | Multiple hostnames may be displayed when reviewing Data Sources in the User Experience dashboard. |
| DEM-10460 | Multiple hostnames may be displayed for Windows computers. |
| PAB-281 |
On macOS, MAC address changes can disrupt ADEM RUM functionality,
potentially causing inconsistent monitoring results for users on
these devices.
|
| APL-28589 | The PAB user count is not correctly displayed on the Users Page, which can lead to inaccurate user metrics in your reporting. |
| DEM-9586 | The device icon under the path to a domain appears greyed out in the interface, which may cause confusion when attempting to trace network paths. |
| DEM-9703 | When viewing Application Performance Metrics, the PAB version information is not displayed under Browser Type, making it difficult to identify which browser versions are being used. |
| DEM-10079 | For GlobalProtect (GP) users, you may observe that user devices are not properly displaying all connected devices under the User Page. |
| DEM-10108 | Proxy-only users on Windows systems are not properly updated in the ADEM portal under the Users page. |
| DEM-10242 | The RUM extension currently has limited logging capabilities. An enhancement to add configurable Log Level settings is in development, which will improve troubleshooting capabilities in future releases. |
| DEM-10386 | When a GP user switches to a new tenant, the RUM Extension may fail with a "Failed to post payload to portal" error, interrupting data collection for that user. |
| DEM-10410 | You may notice duplicate hostname displays for a single Windows endpoint machine, which can lead to confusion when identifying specific devices in your environment. |
| DEM-10411 | When traffic to an application domain routes through Prisma Access, the Prisma Access and Internet icons are not updated correctly, potentially misrepresenting the actual traffic path. |
Autonomous DEM Agent 5.4
| ID | Description |
|---|---|
|
AIOPS-6541
|
On the
Insights > Prisma Access
Locationspage, information in the Strata Logging
Service connectivity widget doesn’t match the information in the
table.
|
|
AIOPS-6421
|
On the Incidents and Alerts Prisma AccessUpdate Profile page, the Save button is unavailable on the
configuration page for the IAM Admin role. Therefore, any
updates to the Notification profile by the IAM Admin role cannot
be saved.
|
|
AIOPS-5934
|
On the SASE Health Dashboard, incidents are filtered by Compute
Location instead of Prisma Access Location.
|
|
DEM-9183
| If you had application tests configured before the UI
change that occurred in December 2024, the Advanced OptionsRemote Sites Test OptionsApplication Entities field in app test configuration appears to be
ANY, but in the backend, its value is the
App-ID of the app test target. Workaround: To actually
choose ANY, select
ANY from the dropdown and
Save the test. Failure to do this could
result in the app test not working because, on devices running
ION 6.4.2 or later, the test will run only if you've configured
an SD-WAN path policy rule for the application test
target. |
| DEM-9086 | In app test configuration, under Advanced OptionsRemote Sites Test OptionsApplication Entities, App-IDs do not appear as options in the dropdown, even if the test has an application name configured and you have SD-WAN path policy rules on your ION devices configured for specific applications. |
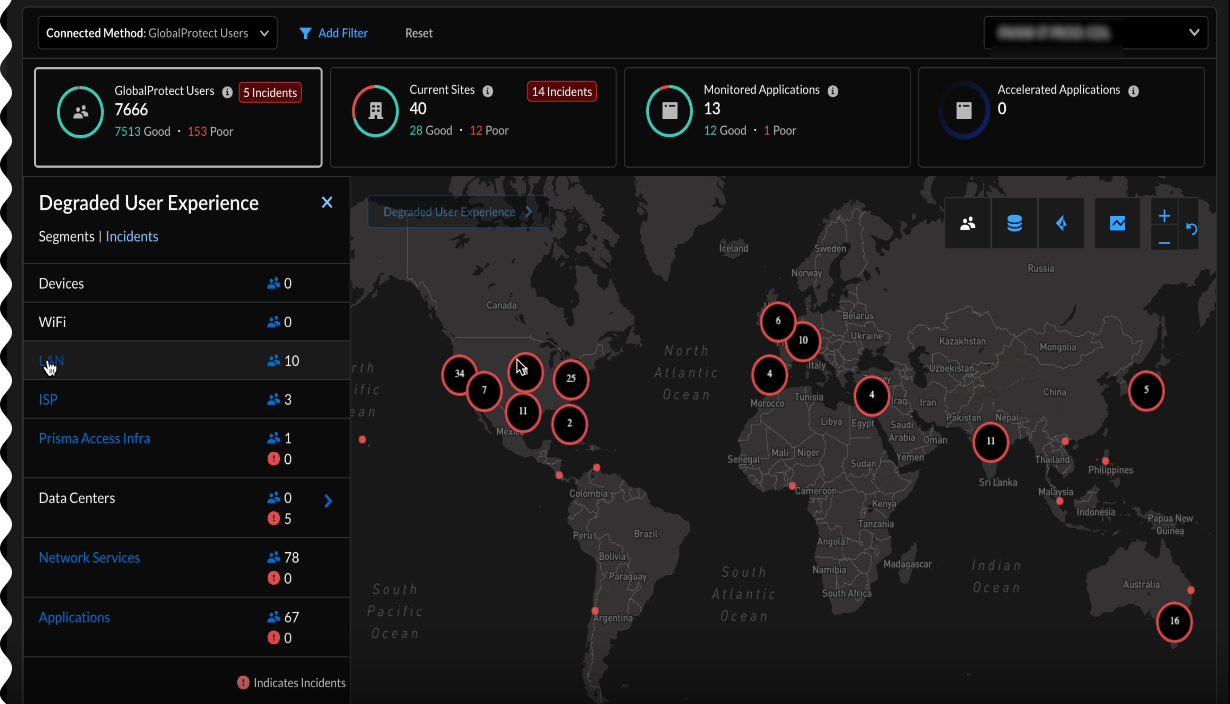
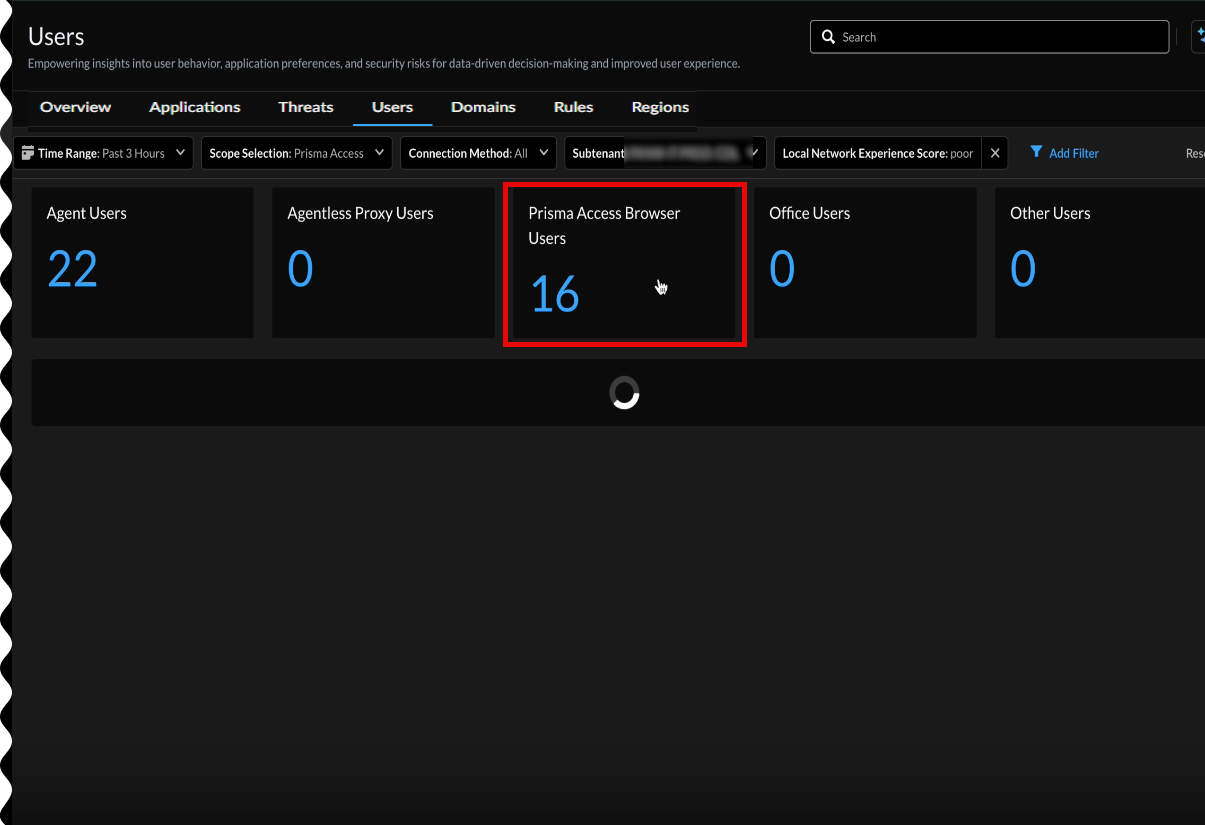
| DEM-9034 | In
InsightsSASE Health, the number of users that appears next to a segment,
such as LAN, does not match the number of users with degraded
experience that you see after you select the user count.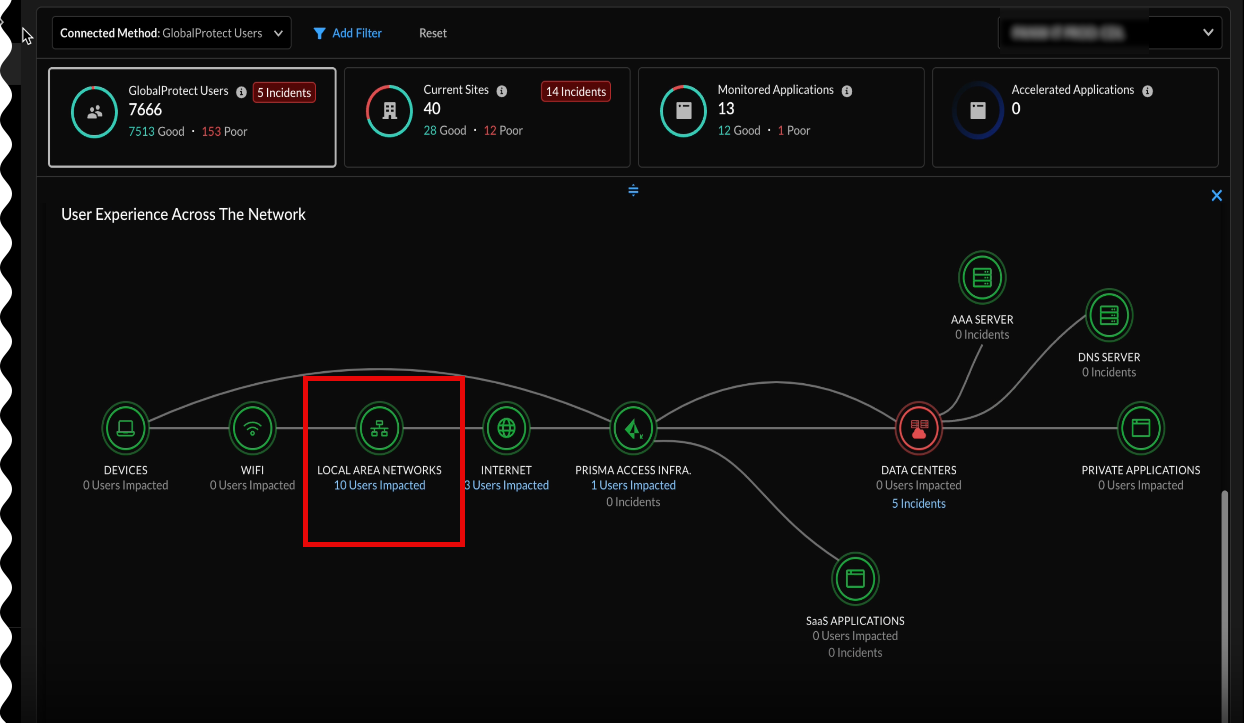
|
| DEM-8709 | If you're collecting both Real User Monitoring (RUM) and synthetic test data, you may experience up to a 40-minute delay before you see combined results in ADEM dashboards. |
|
DEM-8366
|
Under InsightsSASE HealthMonitored Applications, when Proxy alone is deployed in a particular
Prisma Access Location, we do not observe that location and its
details on the Monitored Applications map.
|
|
DEM-8217
|
The Strata Cloud Manager auto-generated PAC file contains an
expression with a $ symbol. The ADEM agent is unable to process
the $ symbol and provides inaccurate results on the ADEM
portal.
Workaround: Enable the PAC File
Upload check-box, upload the custom PAC file
with the same configuration (but without the $ symbol), and save
the configuration.
|
|
DEM-7548
|
The Apple macOS Sequoia 15+ version affects ADEM Agent
installations as follows:
|
|
DEM-5154
|
When logged in as “ADEM Tier 1 Support” role, the SD-WAN tab is
not visible on theMonitorBranch Sites page.
Workaround: Add the “View-only
Administrator” role to the Prisma SD-WAN application to view the
SD-WAN tab and the Branch Sites ADEM data under this tab.
|
|
DEM-4686
|
ADEM may not be able to identify every problem that may impact a
user's calls. For example, WiFi disconnect will impact a Zoom
meeting, but will also stop ADEM synthetic tests. As a result,
the Number of minutes with issues field
in the Overall Zoom Performance Impact
widget and the Impacted Minutes field of
the Zoom Poor Performance Root Cuases
widget may not match.
|
| DEM-4630 | On the User Details page and the Application Details page, the Historical Synthetics tab displays even if you have not selected the Zoom application. |
| DEM-4349 |
The Map View tab of the Prisma Access
Locations page displays edge locations such as Hungary and
Slovakia as part of the Israel compute location even though
Israel is now a part of me-west-1 location.
|
| DEM-4248 |
If the web tests are disabled for an application test, and the
network performance probes for that test are failing, score for
these tests will be displayed as null (grey tile) on the Prisma
Access Locations page.
|
| DEM-3992 |
The ADEM dashboard may list one or more user specific attributes
for multiple clients. For example, the user location or the
hostname may reflect the same value for multiple users. This
happens if their Windows GUID is identical.
Make sure the Windows GUID is unique for all the machines. Then
reinstall the agent to get the correct status updated.
|
| DEM-3873 |
After the ADEM license expires, the Self-Serve feature will
continue to work for a grace period of 30 days. At the end of
the 30-day grace period, the notifications get disabled on both
Macintosh and Windows. On Macintosh, if you click the
Application Experience menu bar icon,
the UI will open and notify you that the notifications are
disabled. On Windows, the Application
Experience icon in the task bar gets removed.
|
| DEM-3798 |
Users receive the Self-Serve notifications regardless of whether
they are online or offline. If and when a user's device gets
disconnected from the ADEM portal (the device goes offline),
users will continue to receive Self-Serve notifications on their
device during the period that the device is offline. However,
the notification count will not get updated on the ADEM portal.
|
| DEM-3139 |
If a user belongs to multiple user groups, then The
Mobile Users Group filter on the
Applications page returns
applications assigned to all groups that the user belongs to,
not just the selected group in the filter.
|
| DEM-3129 |
Custom apps that are deleted from Prisma Access continue to show
in the Autonomous DEM portal.
|
| DEM-3066 |
When ADEM is accessed from the Prisma Access App, only those
security groups currently used in one or more security policies
are displayed. On Panorama LDAP, all user groups are
displayed.
|
| DEM-2993 | When monitoring is enabled for a remote site, if the data is not received by the ADEM portal for that site, the site does not display in Monitored Remote Sites dashboard. |
| DEM-2834 | If you make a modification to the application test configuration, you may see data gaps of 5 mins interval on the application experience trend and performance metrics chart for the remote site. |
| DEM-2815 |
The application score that is displayed on the "Global
Distribution of Application Experience Scores for Remote Sites"
does not match the score on the Remote Sites page. The first
score is an average score filtered by location. The second score
(Remote Sites) is an average of the average score for each
remote site.
|
| DEM-2777 |
Any ADEM license changes for Remote Networks (For example, SPN
bandwidth allocations) can take between 1 to 4 hours to reflect
in the UI.
|
| DEM-2717 |
When logging into ADEM as a Data Security Manager, the page fails
to load displaying the following error:“Maximum update depth
exceeded. This can happen when a component repeatedly calls
setState inside componentWillUpdate or componentDidUpdate. React
limits the number of nested updates to prevent infinite
loops.”
|
| DEM-2596 |
When you have 200K ADEM agents or more, the
Settings page in ADEM fails to load.
This is an intermittent issue and is typically observed when
multiple users are trying to access the
Summary page in parallel.
Workaround: Refresh the page or try re-logging into
ADEM.
|
| DEM-2477 |
After selecting Application filter, the Location Details page
fails to load the performance trends and path visualization tabs
data.
|
| DEM-2048 |
When performing a new installation of GlobalProtect 5.2.10 or
later on an M1 MacBook device that does not have Rosetta 2
installed, the Autonomous DEM agent does not get installed even
though the message that GlobalProtect displays indicates that
the agent installed successfully.
Workaround: Manually install Rosetta 2 on the M1 MacBook
device and then refresh the GlobalProtect connection to enable
GlobalProtect to re-initiate the install of the Autonomous DEM
agent.
|
| DEM-1457 |
On a Windows operating system running GlobalProtect version
5.2.8, if the endpoint is in a Trusted network with VPN tunnel
established to the internal gateway, the ADEM portal displays
the GlobalProtect status as
Connected-Internal and VPN status as
Disabled. The trend line shows a blue
background indicating that the test was run while VPN was
disabled.
|
| DEM-253 |
For applications that are being split tunneled, the synthetic
test does not perform a trace path to display a hop-by-hop
detailed topology on the UserUser Details page for the specific application. The telemetry
from the application and network performance tests are collected
and available on Autonomous DEM.
|
| DEM-198 |
Prisma Access LocationsTopology View does not visually identify the hop details.
|
| DEM-191 |
Synthetic tests from Prisma Access location vantage points are
performed on all Prisma Access locations within a given region,
even if you have not deployed the infrastructure to that
specific location. You may see additional locations on the
Prisma Access Locations page.
|
| DEM-183 |
When you install GlobalProtect app 5.2.6 on macOS devices, the
pop-up prompt appears, prompting end users for administrative
privileges to modify system settings.
Workaround: Select OK so that the
pop-up prompt does not appear again.
|
| DEM-105 |
Autonomous DEM does not run network performance tests to the
service connection, and hence the network performance metrics
are not measured for service connections. The service connection
is included when tracing the network path from the endpoint to
the application.
|
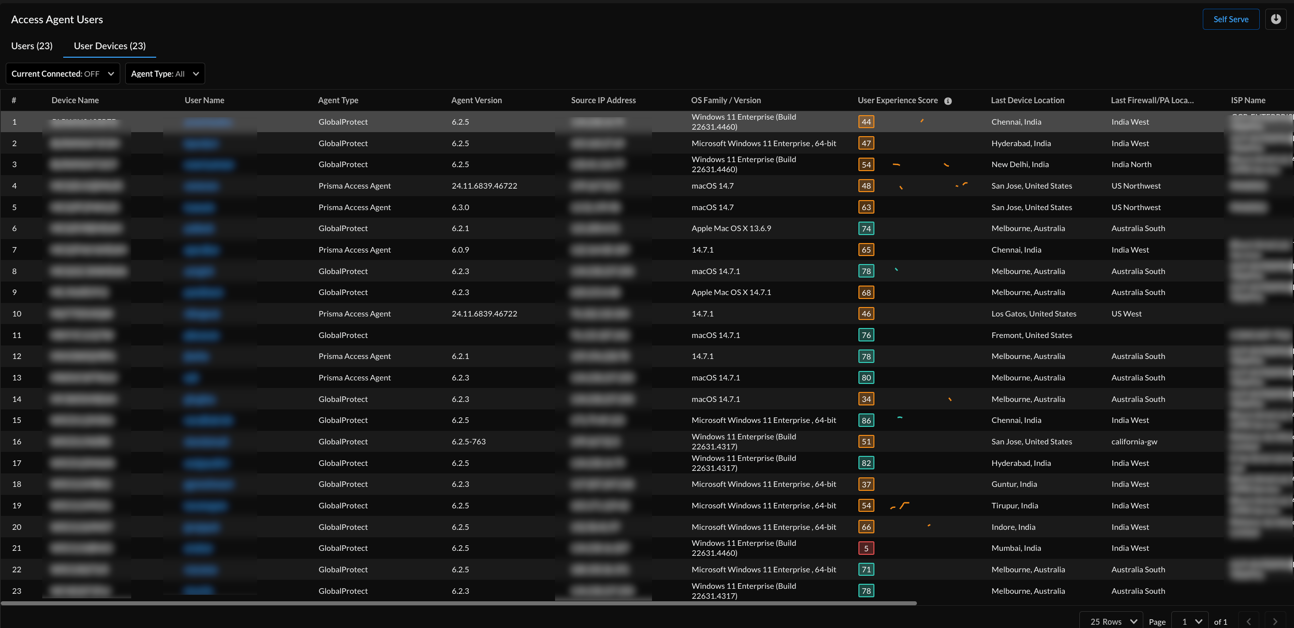
| NETVIS-3095 | In InsightsActivity InsightsUsersAgent Users or InsightsActivity InsightsUsersPAB Users when you Add Filter, the data
in the Access Agent Users table may not match that which is in the
Monitored Users widget. For example, if the table shows a user
device with poor experience, the widget may not reflect that in the
count of user devices with poor experience.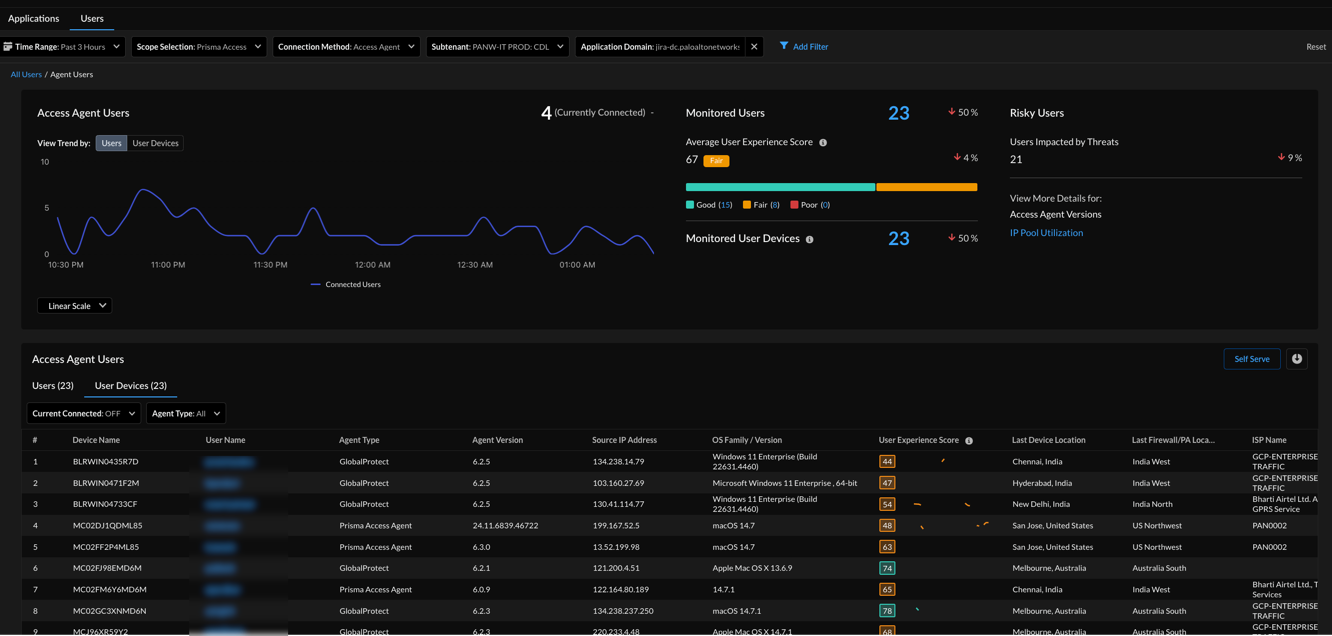
|
Autonomous DEM Agent 5.1
| ID | Description |
|---|---|
| DEM-7293 | When using macOS version Sonoma 14.5 with ADEM agent version 5.0.15, the Access Experience page shows the connected SSID appears as <redacted> instead of the actual SSID name. |
| DEM-2596 | When you have 200K ADEM agents or more,
the Settings page in ADEM fails to load. This is an
intermittent issue and is typically observed when multiple users
are trying to access the Summary page in
parallel. Workaround: Refresh the page or try
re-logging into ADEM. |
| DEM-2048 |
When performing a new installation of GlobalProtect 5.2.10 or
later on an M1 MacBook device that does not have Rosetta 2
installed, the Autonomous DEM agent does not get installed even
though the message that GlobalProtect displays indicates that
the agent installed successfully.
Workaround: Manually install Rosetta 2 on the M1 MacBook
device and then refresh the GlobalProtect connection to enable
GlobalProtect to re-initiate the install of the Autonomous DEM
agent.
|
