IoT Security
IoT Security Integration Status with Prisma Access
Table of Contents
IoT Security Integration Status with Prisma Access
Check the integration of IoT Security with Prisma Access
on the Sites and Firewalls pages in the IoT Security portal.
| Where Can I Use This? | What Do I Need? |
|---|---|
|
|
In the IoT Security portal, the Sites and Firewalls pages provide the status of next-generation
firewalls with active IoT Security subscriptions. They show the total number of
firewalls at each site, the connection status of each firewall, the total number of log
events they’ve forwarded to logging services, and the types of logs they’re sending.
However, when Prisma Access subscribes to IoT Security through the IoT Security add-on,
the information displayed on these pages is unlike that shown for next-generation
firewalls.
Sites
When Prisma Access is using an IoT Security add-on, the site name for it on the page is simply “Prisma Access”. Whether a single Prisma Access
instance is protecting one or a hundred remote sites, IoT Security remains unaware
of their number. From the perspective of IoT Security, the numbers of devices and
IoT devices come from a single Prisma Access entity regardless of how many remote
sites it protects.
The following screen capture
shows a mixed deployment of Prisma Access and several sites with
on-premises next-generation firewalls for comparison.
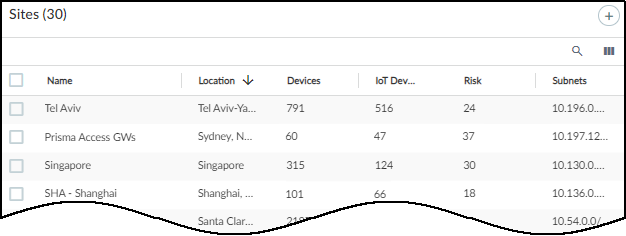
The Sites page contains
the following types of information for Prisma Access:
Status: A green cloud means that IoT Security is connected to Prisma Access and
is receiving logs. A red cloud with a line through it means that IoT Security
does not detect logs forwarded from Prisma Access to Strata Logging Service.
Name: Prisma Access
Location: This is the site location, if a location was previously defined.
Devices:
This is the total number of devices that IoT Security identified
across all remote sites under Prisma Access protection.
IoT Devices: This is the total number of IoT devices that Prisma Access identified
across all its remote sites. This is a subset of the total shown in the Devices
column.
Risk: This
is the overall risk score calculated for all IoT devices protected
by Prisma Access.
Subnets: These are the subnets across all Prisma Access remote sites. Because IoT Security has no visibility into how many sites Prisma Access is
protecting, this might come from a single site with a single subnet, a single site
with multiple subnets, multiple sites each with a single unique subnet, multiple
sites with multiple subnets, or any combination of these scenarios.
Group: This indicates the group within the hierarchical site organization where
the site is positioned.
Source: If IoT Security has a third-party integration with BlueCat IPAM or
Infoblox IPAM and learns site names from there, the name of the integration appears
here. When a third-party integration isn't how IoT Security learned of a site, a
dash appears here.
Firewalls
This page () is not particularly applicable to Prisma Access. If you are
using IoT Security exclusively with Prisma Access, the top of the page
shows a total of two sites, one for Prisma Access and one for the default site,
which is where IoT Security initially assigns on-premises firewalls. The
Active and Inactive status will be 1 or 0 depending on whether IoT Security
detects any logs from Prisma Access to Strata Logging Service in the last
30 minutes.
IoT Security displays the number of system alerts
relating to Prisma Access. These pertain to the reception of requests
from Prisma Access for policy recommendations and IP address-to-device
mappings. For example:
IoT Security hasn't received any requests for policy recommendations in
the past 30 minutes.
IoT Security is receiving requests for IP address-to-device mappings again.
Click the number of system alerts at the top of the Firewalls page to open to see them. The source for Prisma Access system alerts is
always All firewalls.
The rest of the Firewalls page doesn’t have any data relevant to Prisma Access.
If
your deployment includes a mix of Prisma Access and on-premises
next-generation firewalls, then this page contains the information
mentioned above for Prisma Access and much more information about
firewalls and the logs they provide.