IoT Security
Device Profile Behaviors
Table of Contents
Expand All
|
Collapse All
IoT Security Docs
-
-
- Firewall Deployment Options for IoT Security
- Use a Tap Interface for DHCP Visibility
- Use a Virtual Wire Interface for DHCP Visibility
- Use SNMP Network Discovery to Learn about Devices from Switches
- Use Network Discovery Polling to Discover Devices
- Use ERSPAN to Send Mirrored Traffic through GRE Tunnels
- Use DHCP Server Logs to Increase Device Visibility
- Control Allowed Traffic for Onboarding Devices
- Support Isolated Network Segments
-
Device Profile Behaviors
View observed network behaviors of IoT devices in the
same device profile across multiple IoT Security tenants.
| Where Can I Use This? | What Do I Need? |
|---|---|
|
|
To access the Overview page of a device profile, select AssetsProfiles >
profile_name
> Behaviors.
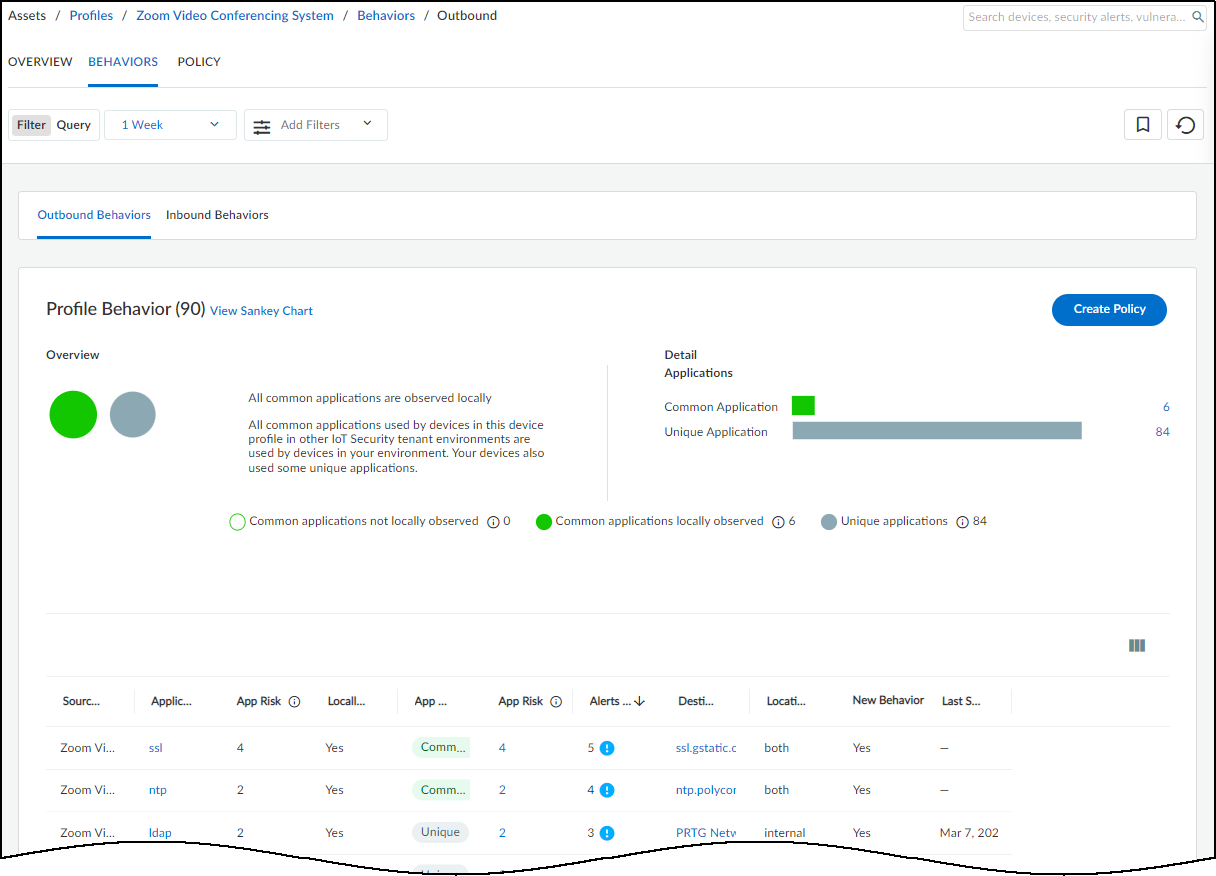
The Behaviors page displays the behaviors of high-confidence
IoT devices in this profile. These are IoT devices that IoT Security
has identified with a high degree of confidence and has calculated
a confidence score of 90-100%. The behaviors are those of IoT devices
belonging to the same profile in your local network environment
and in the network environments of other IoT Security tenants.
A confidence score indicates the level of confidence IoT Security has in its identification of a device. IoT Security has
three confidence levels based on calculated confidence scores: high
(90-100%), medium (70-89%), and low (0-69%).
Filter the Content Displayed
The behaviors displayed on this page and in the related
Sankey chart are controlled by the filters at the top of the page;
the option to show either outbound or inbound behaviors; and the
option to show common applications, unique applications, or both
(the default) under Applications in the Profile Behaviors section.
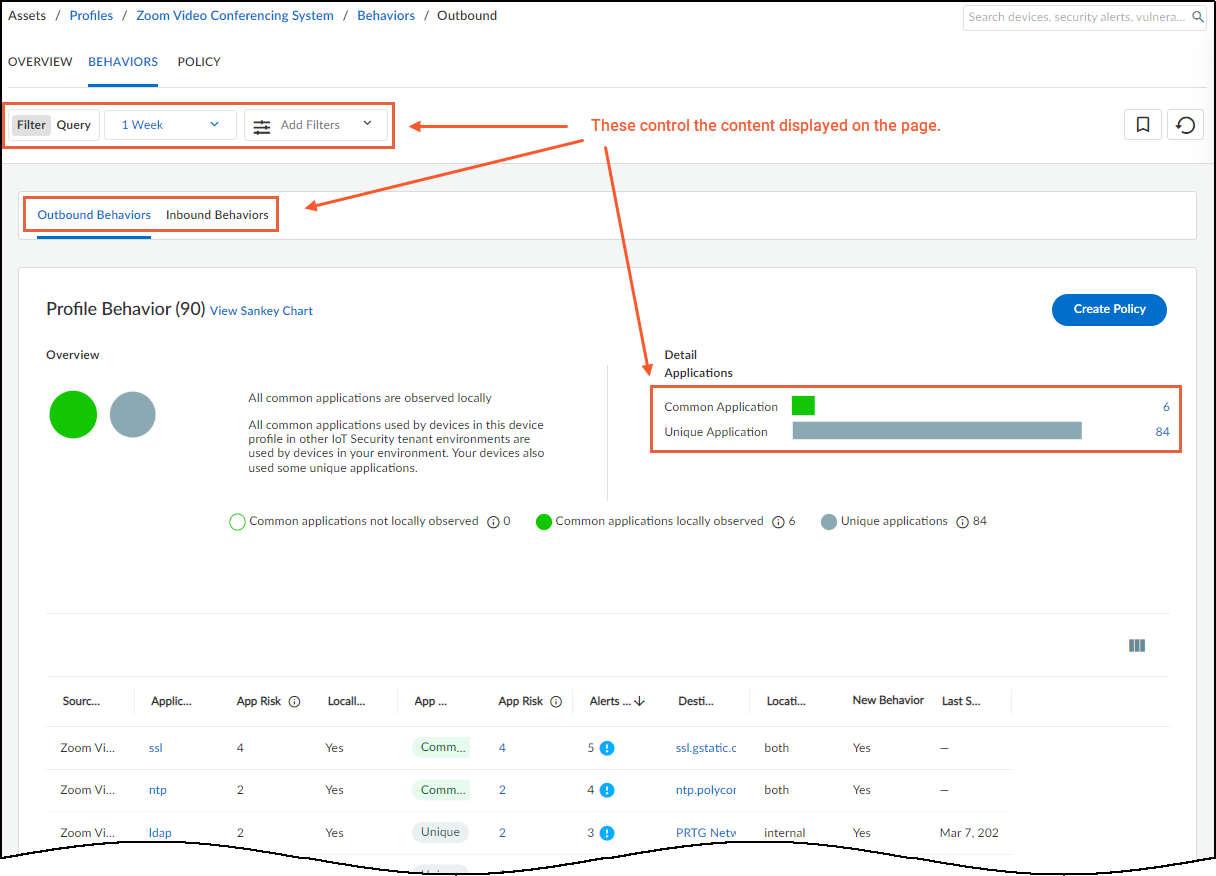
The time filter also determines which outbound, or inbound, behaviors
are displayed.
You can only create a policy rule set for outbound behaviors;
that is, when the source of a behavior is an IoT device in a device
profile. IoT Security does not generate policy rule recommendations
for inbound behaviors, which is when the IoT device is the destination.
Time filter – The time filter controls the behaviors displayed
on the Behaviors page by when each behavior was observed on the
network during the past 1 Day (past 24 hours up until now), past
1 Week, or past 1 Month. Clicking the Reset filter icon
(
 ) sets the time
to 1 Day and removes any additional filters you might have set.


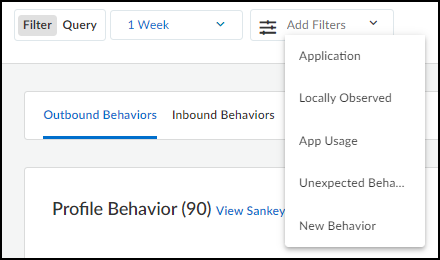
Add Filters – Add filters to show specific
types of behaviors. Select one or more of the following:
- Applications – Select and choose one or more applications to show on the page. The applications listed were part of high-confidence IoT device behaviors observed on the network during the period of time set in the time filter.
- Local Observed – Select and choose Yes to show behaviors observed locally in your network or No to hide locally observed behaviors.
- App Usage – Select and determine what to show based on where behaviors were observed:
- Common only are behaviors that were observed in other IoT Security tenant environments but not in yours.
- Common and local are behaviors observed in other tenant environments and in yours.
- Local only are behaviors observed in your environment but not in the environment of any other tenant.
- Unexpected behavior – Select and choose Yes to show behaviors that were explicitly not permitted when the policy set was activated but have since appeared on the network. Choose No to hide unexpected behaviors.
- New behavior – Select and choose Yes to show behaviors discovered on the network after the last policy set activation. Choose No to hide new behaviors.
None of these filters nor the time filter determines which
behaviors to include in any policy sets you might create. They only
determine what to show on the Behaviors page. However, once you
start the process of creating a policy set, IoT Security presents
a similar set of filters to use within the context of policy creation.
As you add and remove filters, the number in parentheses next
to “Profile Behavior” changes accordingly. Refer to this for a quick
reference of how the filters affect the number of behaviors that
appear on the page while the filters are in place.

Outbound Behaviors and Inbound
Behaviors – By default outbound behaviors are shown.
These are behaviors in which this device profile is the source of
network activity.
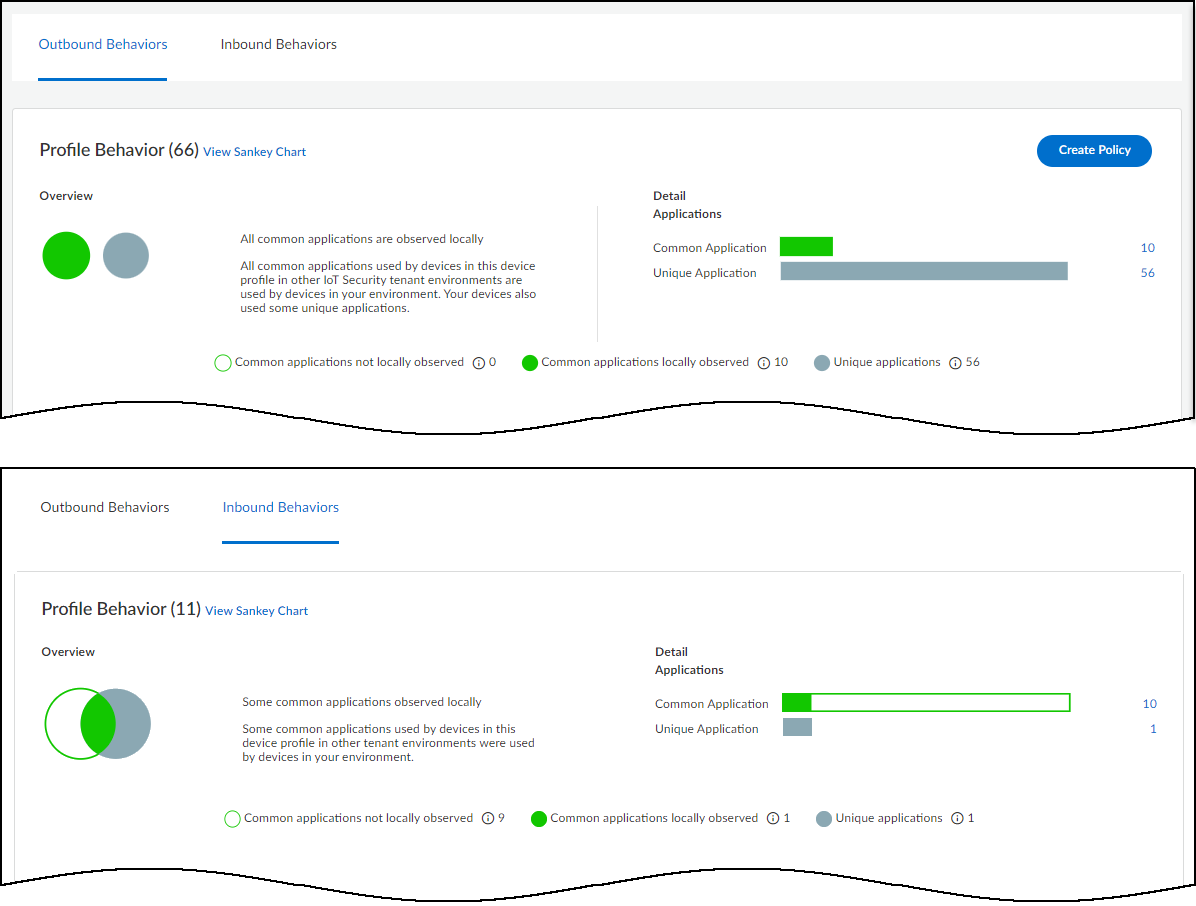
In the upper screen capture of the two below, there are 66 outbound
behaviors:
- 10 outbound behaviors include common applications observed in both your and other tenants’ environments. These are indicated with a green fill in the Venn diagram and bar chart.
- 56 include applications that are unique to your environment. These are indicated as gray.
In the lower screen capture, there are 11 inbound behaviors,
which are behaviors in which this device profile is the destination
of network activity:
- 9 inbound behaviors include common applications observed in other tenants’ environments but not in yours. These are indicated with a green outline in the Venn diagram and bar chart.
- 1 includes a common application observed in both your and other tenants’ environments. This is indicated with a green fill.
- 1 includes a unique application observed only in your environment. This is indicated as gray.
The direction you choose—outbound or inbound—controls what’s
shown in the list at the bottom of the Behaviors page and in the
Sankey chart. Your choice also shows or hides the Create
Policy button, only showing it when Outbound
Behaviors is active. Clicking the number to the right
of the bar charts also controls whether to show common or unique
applications on the page and in the Sankey chart. To undo the filter
applied by clicking either of these numbers, click the Reset filter icon
(
 ) next to the
time filter near the top of the page.
Create a Policy Set
Use IoT Security recommendations to create policy rule
sets based on the observed network behaviors of IoT devices in the
same device profile. For instructions on creating a policy set,
see Create a Policy Set in IoT Security.
From PAN-OS 11.1, there's a different process for recommending
Security policy rules to next-generation firewalls from that described here. The
following workflow remains applicable to firewalls running PAN-OS versions prior
to PAN-OS 11.1.
View the Sankey Chart
A Sankey chart is a diagram with lines indicating connections.
Click View Sankey Chart to open a panel on
the right showing the flow of applications from a source (the current
device profile in outbound behaviors) to destinations and the destination
locations (internal or external). The lines are color coded as explained
above and grouped into these three groups:
- Gray for unique local applications
- Green fill for common applications locally observed
- Green outline for common applications not locally observed
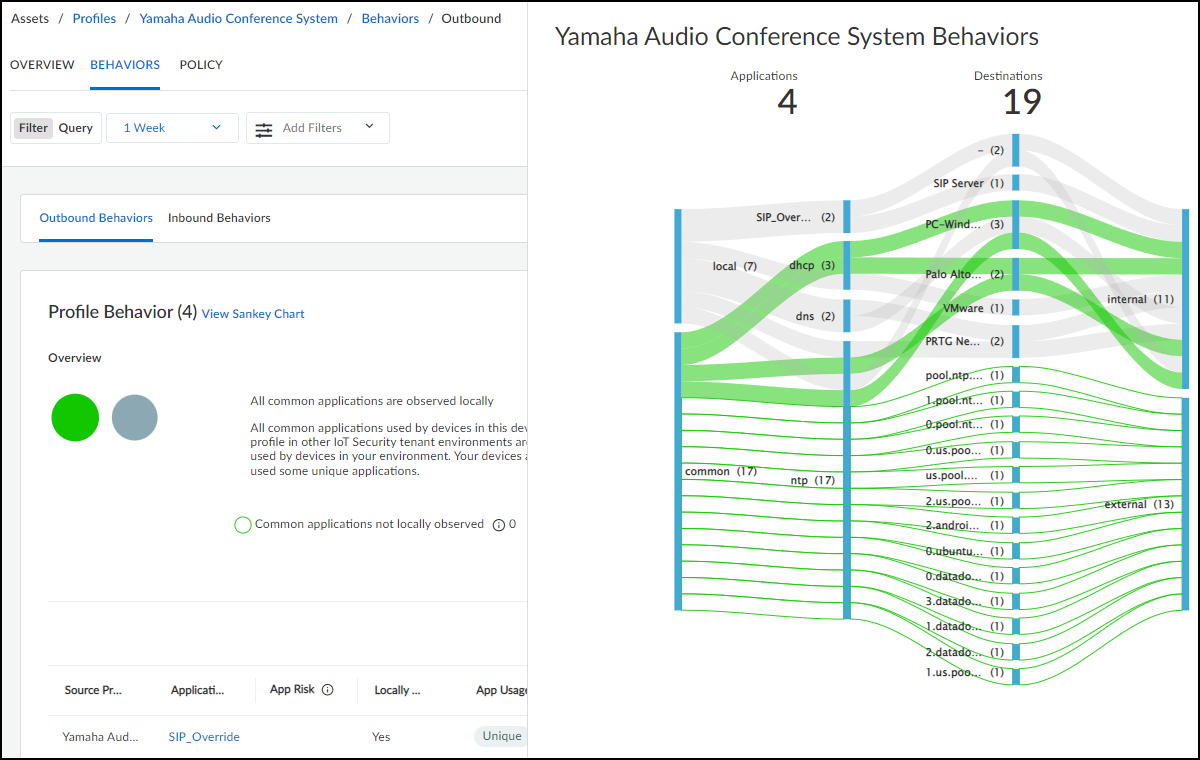
A dash appears for an internal destination when the device
profile of a destination is unknown. The number after a destination
indicates the number of different IP addresses at the destination
profile (for internal destinations) or behind the domain name (for
external destinations).
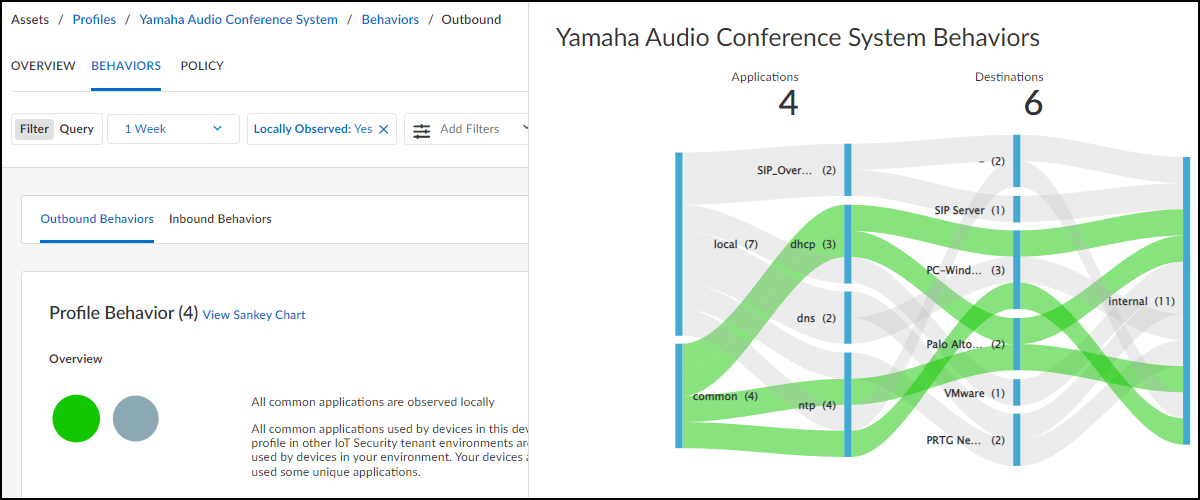
Because the Sankey chart can become overwhelming when there are
lots of lines, you can apply filters to reduce their number. For
example, applying a filter that shows only locally observed applications
reduces the number of lines in the diagram shown above from 24 to
11 while also increasing line width. See below.
You can also apply an application filter. For example, if there
is one application that interests you, you can show only behaviors
that include that. You can also filter by multiple applications.
The following screen capture shows outbound behaviors just for NTP.
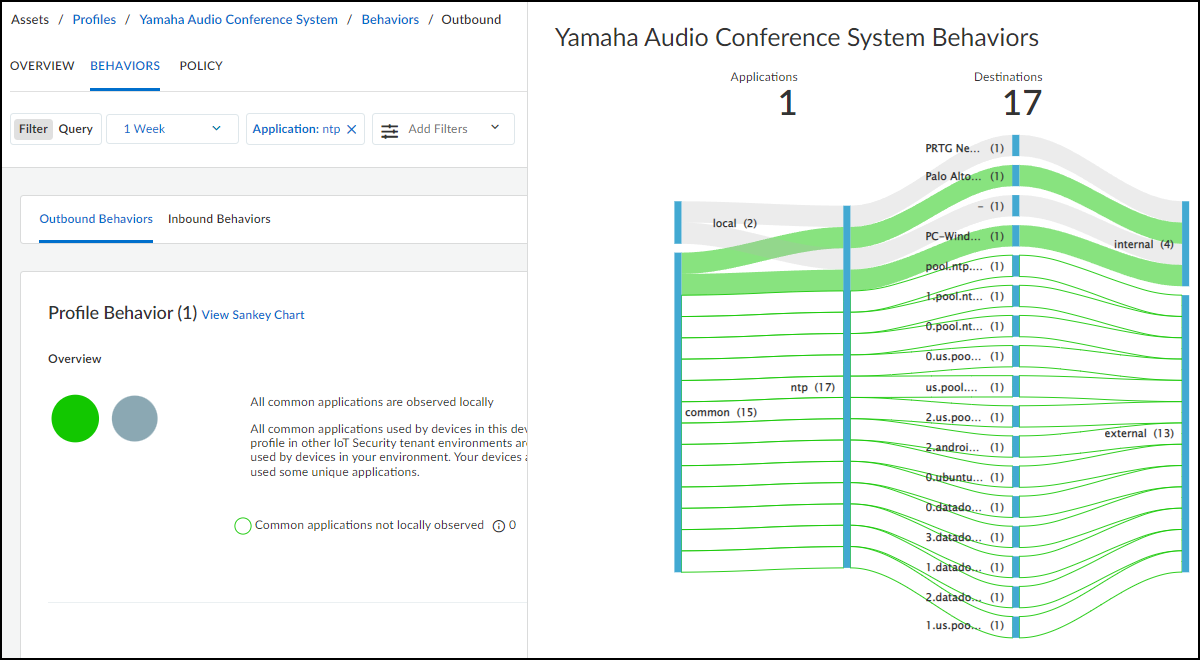
Another feature of the chart is that you can hover your cursor
over lines and blue bars to see information pop-ups. In the screen
capture above, the cursor is hovering over the destination bar where
one of the common behaviors crosses it to show a pop-up identifying
its particular destination. This is useful for seeing complete destination
profile names and domain names, which are abbreviated in the chart.
View the Behaviors Table
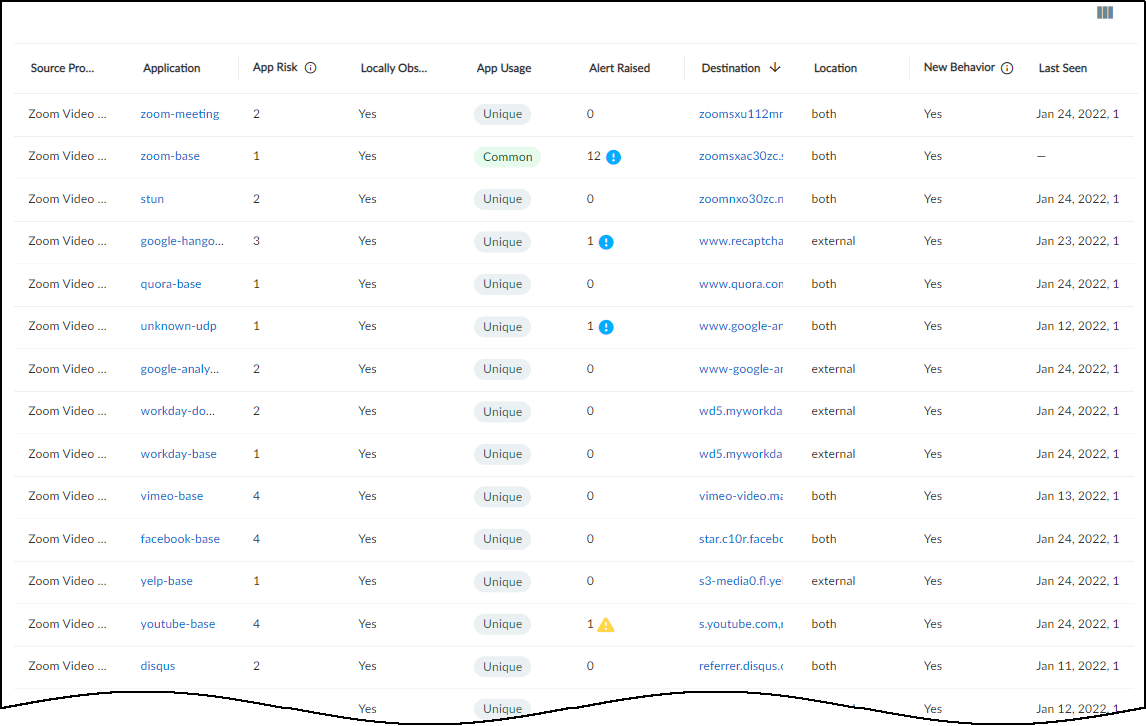
At the bottom of the Behaviors page is a table listing
all the behaviors for this profile matching the filters that have
been set: the time filter and additional filters near the top of
the page, the outbound or inbound behaviors toggle, and the common
or unique application numbers under Detail Applications. The data
in the table is aggregated with behaviors grouped by application.
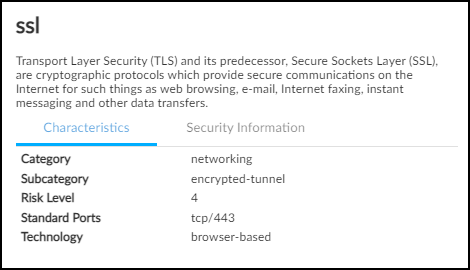
The App Risk column contains the risk level for this application
as defined in Applipedia. Risk levels
are graded from 1 to 5, with numbers approaching 5 carrying increasingly
more risk. Hover your cursor over the application name to display
a pop-up panel with information about the application retrieved
from Applipedia. For explanations about this information, see
Discover IoT Device Applications.
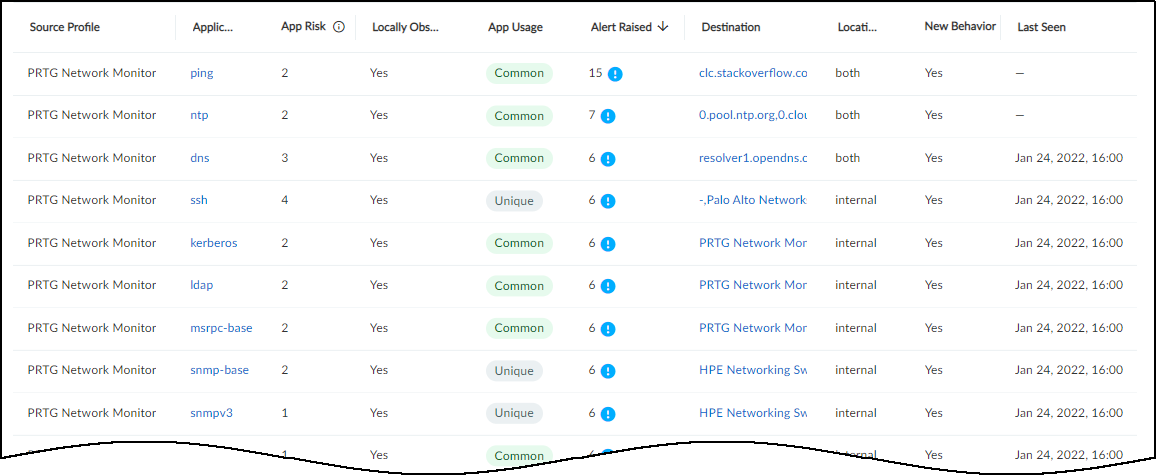
The number of Security alert instances and their severity levels
are presented in the Alerts Raised column. For outbound behaviors,
you can see the number of alert instances that occurred on devices
in the source profile for the application in each row.
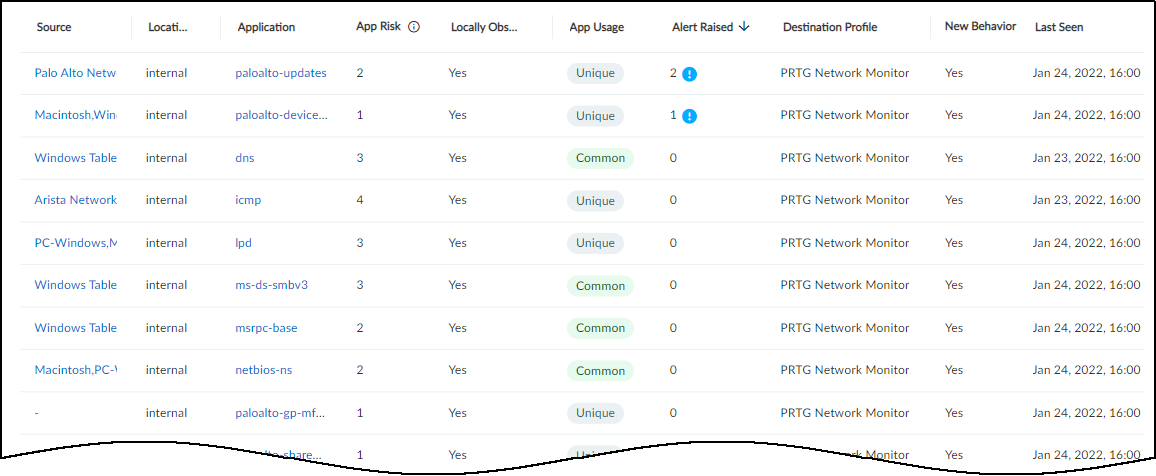
For inbound behaviors, the Alerts Raised column shows the number
of alert instances that occurred on devices in the destination profile
for an application.
Alert instance totals in the Alerts Raised column are grouped
by their severity level: critical, high, medium, and low. The following
icons indicate these four levels:

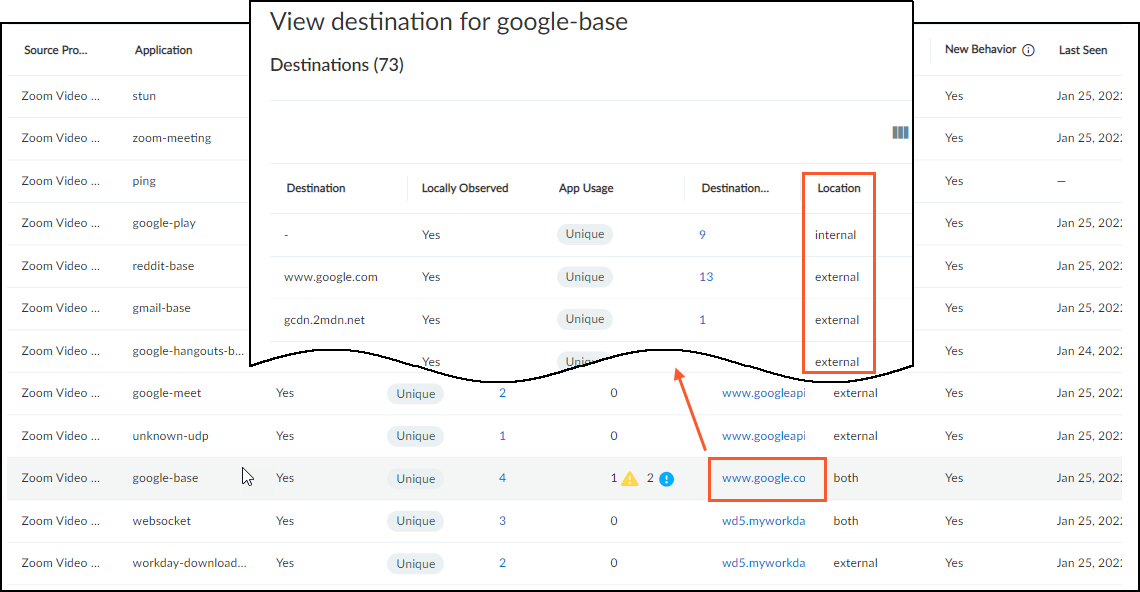
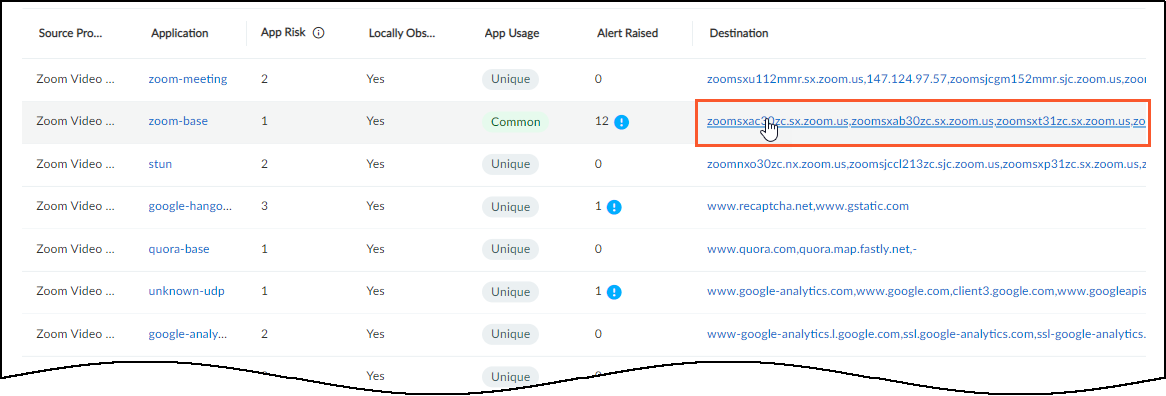
A behavior for a source device profile and application might
have numerous destinations. You can drag the destination column
to widen it but that still might not be sufficient to see all of
them. To open a panel with detailed information, click anywhere
in the destination field.
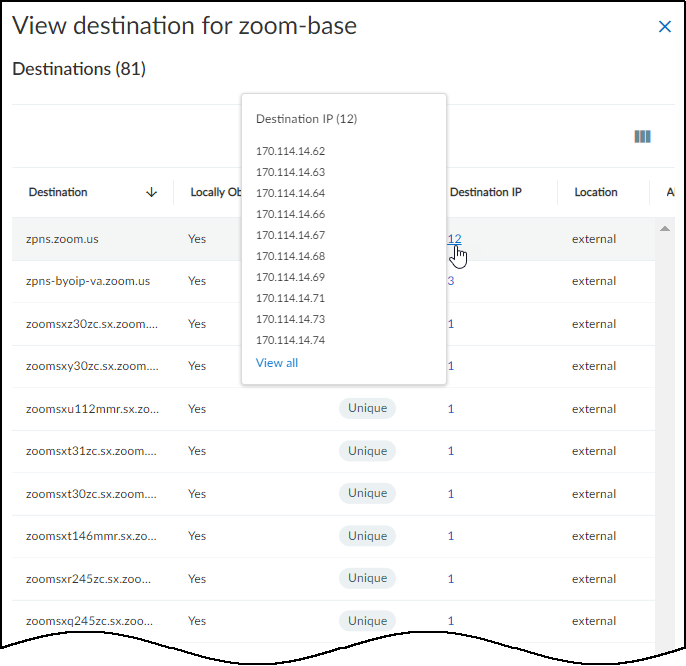
The View Destination for application_name panel provides
its own table with rows for each individual destination to which
devices in the source device profile sent a particular application.
Hover your cursor over a number in the Destination IP column to
see a pop-up with a list of IP addresses.
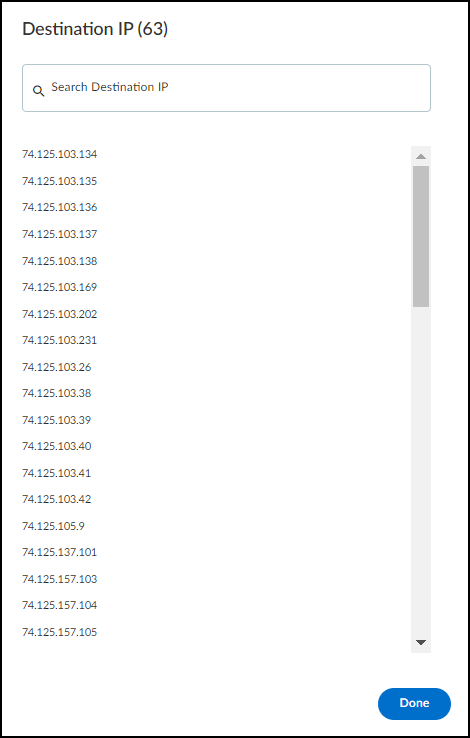
If you are looking for a specific destination IP address and
the list of addresses is too long for the Destination IP pop-up
to display them all, click the number in the Destination IP column
and a dialog box appears with a search option.
In the Behaviors table, the Location column indicates where the
destinations of a behavior are. If all the destinations are in the
local network, the location is internal. If all the destinations
are outside the local network, the destination is external.
If some destinations are internal and some external, then the location
is both. In this case, you can see the location of individual destinations
by clicking in the Destination column in the Behaviors table and
looking at the Location column in the View Destination for application_name panel.
