Network Security
Enable VM Monitoring to Track Changes on the Virtual Network
Table of Contents
Expand All
|
Collapse All
Network Security Docs
Enable VM Monitoring to Track Changes on the Virtual Network
VM information sources provides an automated way to gather information on the Virtual Machine
(VM) inventory on each monitored source (host); the firewall can monitor the VMware
ESXi, vCenter Server, AWS-VPC, Microsoft Azure VNet, and Google Cloud. As virtual
machines (guests) are deployed or moved, the firewall collects a predefined set of
attributes (or metadata elements) as tags; these tags can then be used to define
Dynamic Address Groups (see Use Dynamic Address Groups in
Policy) and matched against in policy.
You can directly configure the firewall or use Panorama
templates to monitor up to 10 VM information sources. VM
Information Sources offers easy configuration and enables
you to monitor a predefined set of 16 metadata elements or attributes.
See Attributes
Monitored on Virtual Machines in Cloud Platforms for the
list. By default, the traffic between the firewall and the monitored
sources uses the management (MGT) port on the firewall.
- When monitoring ESXi hosts that are part of the VM-Series NSX edition solution, use Dynamic Address Groups instead of using VM Information Sources to learn about changes in the virtual environment. For the VM-Series NSX edition solution, the NSX Manager provides Panorama with information on the NSX security group to which an IP address belongs. The information from the NSX Manager provides the full context for defining the match criteria in a Dynamic Address Group because it uses the service profile ID as a distinguishing attribute and allows you to properly enforce policy when you have overlapping IP addresses across different NSX security groups. Up to a maximum of 32 tags (from vCenter server and NSX Manager) that can be registered to an IP address.
- For monitoring the virtual machines within your Azure deployment, instead of VM Monitoring Sources, you need to deploy the VM Monitoring script that runs on a virtual machine within the Azure public cloud. This script collects the IP address-to-tag mapping information for your Azure assets and publishes it to the firewalls and corresponding virtual systems you specify in the script.
- For Panorama version 8.1.3 and later, you can also use the Panorama plugin for AWS or Azure to retrieve VM Information and register it to the managed firewalls. See Attributes Monitored on Virtual Machines in Cloud Platformsfor details.
- Enable VM Monitoring.You can configure up to 10 VM information sources for each firewall, or for each virtual system on a multiple virtual systems capable firewall.If your firewalls are configured in a high availability configuration:
- In an active/passive setup, only the active firewall monitors the VM sources.
- In an active/active setup, only the firewall with the priority value of primary monitors the VM sources.
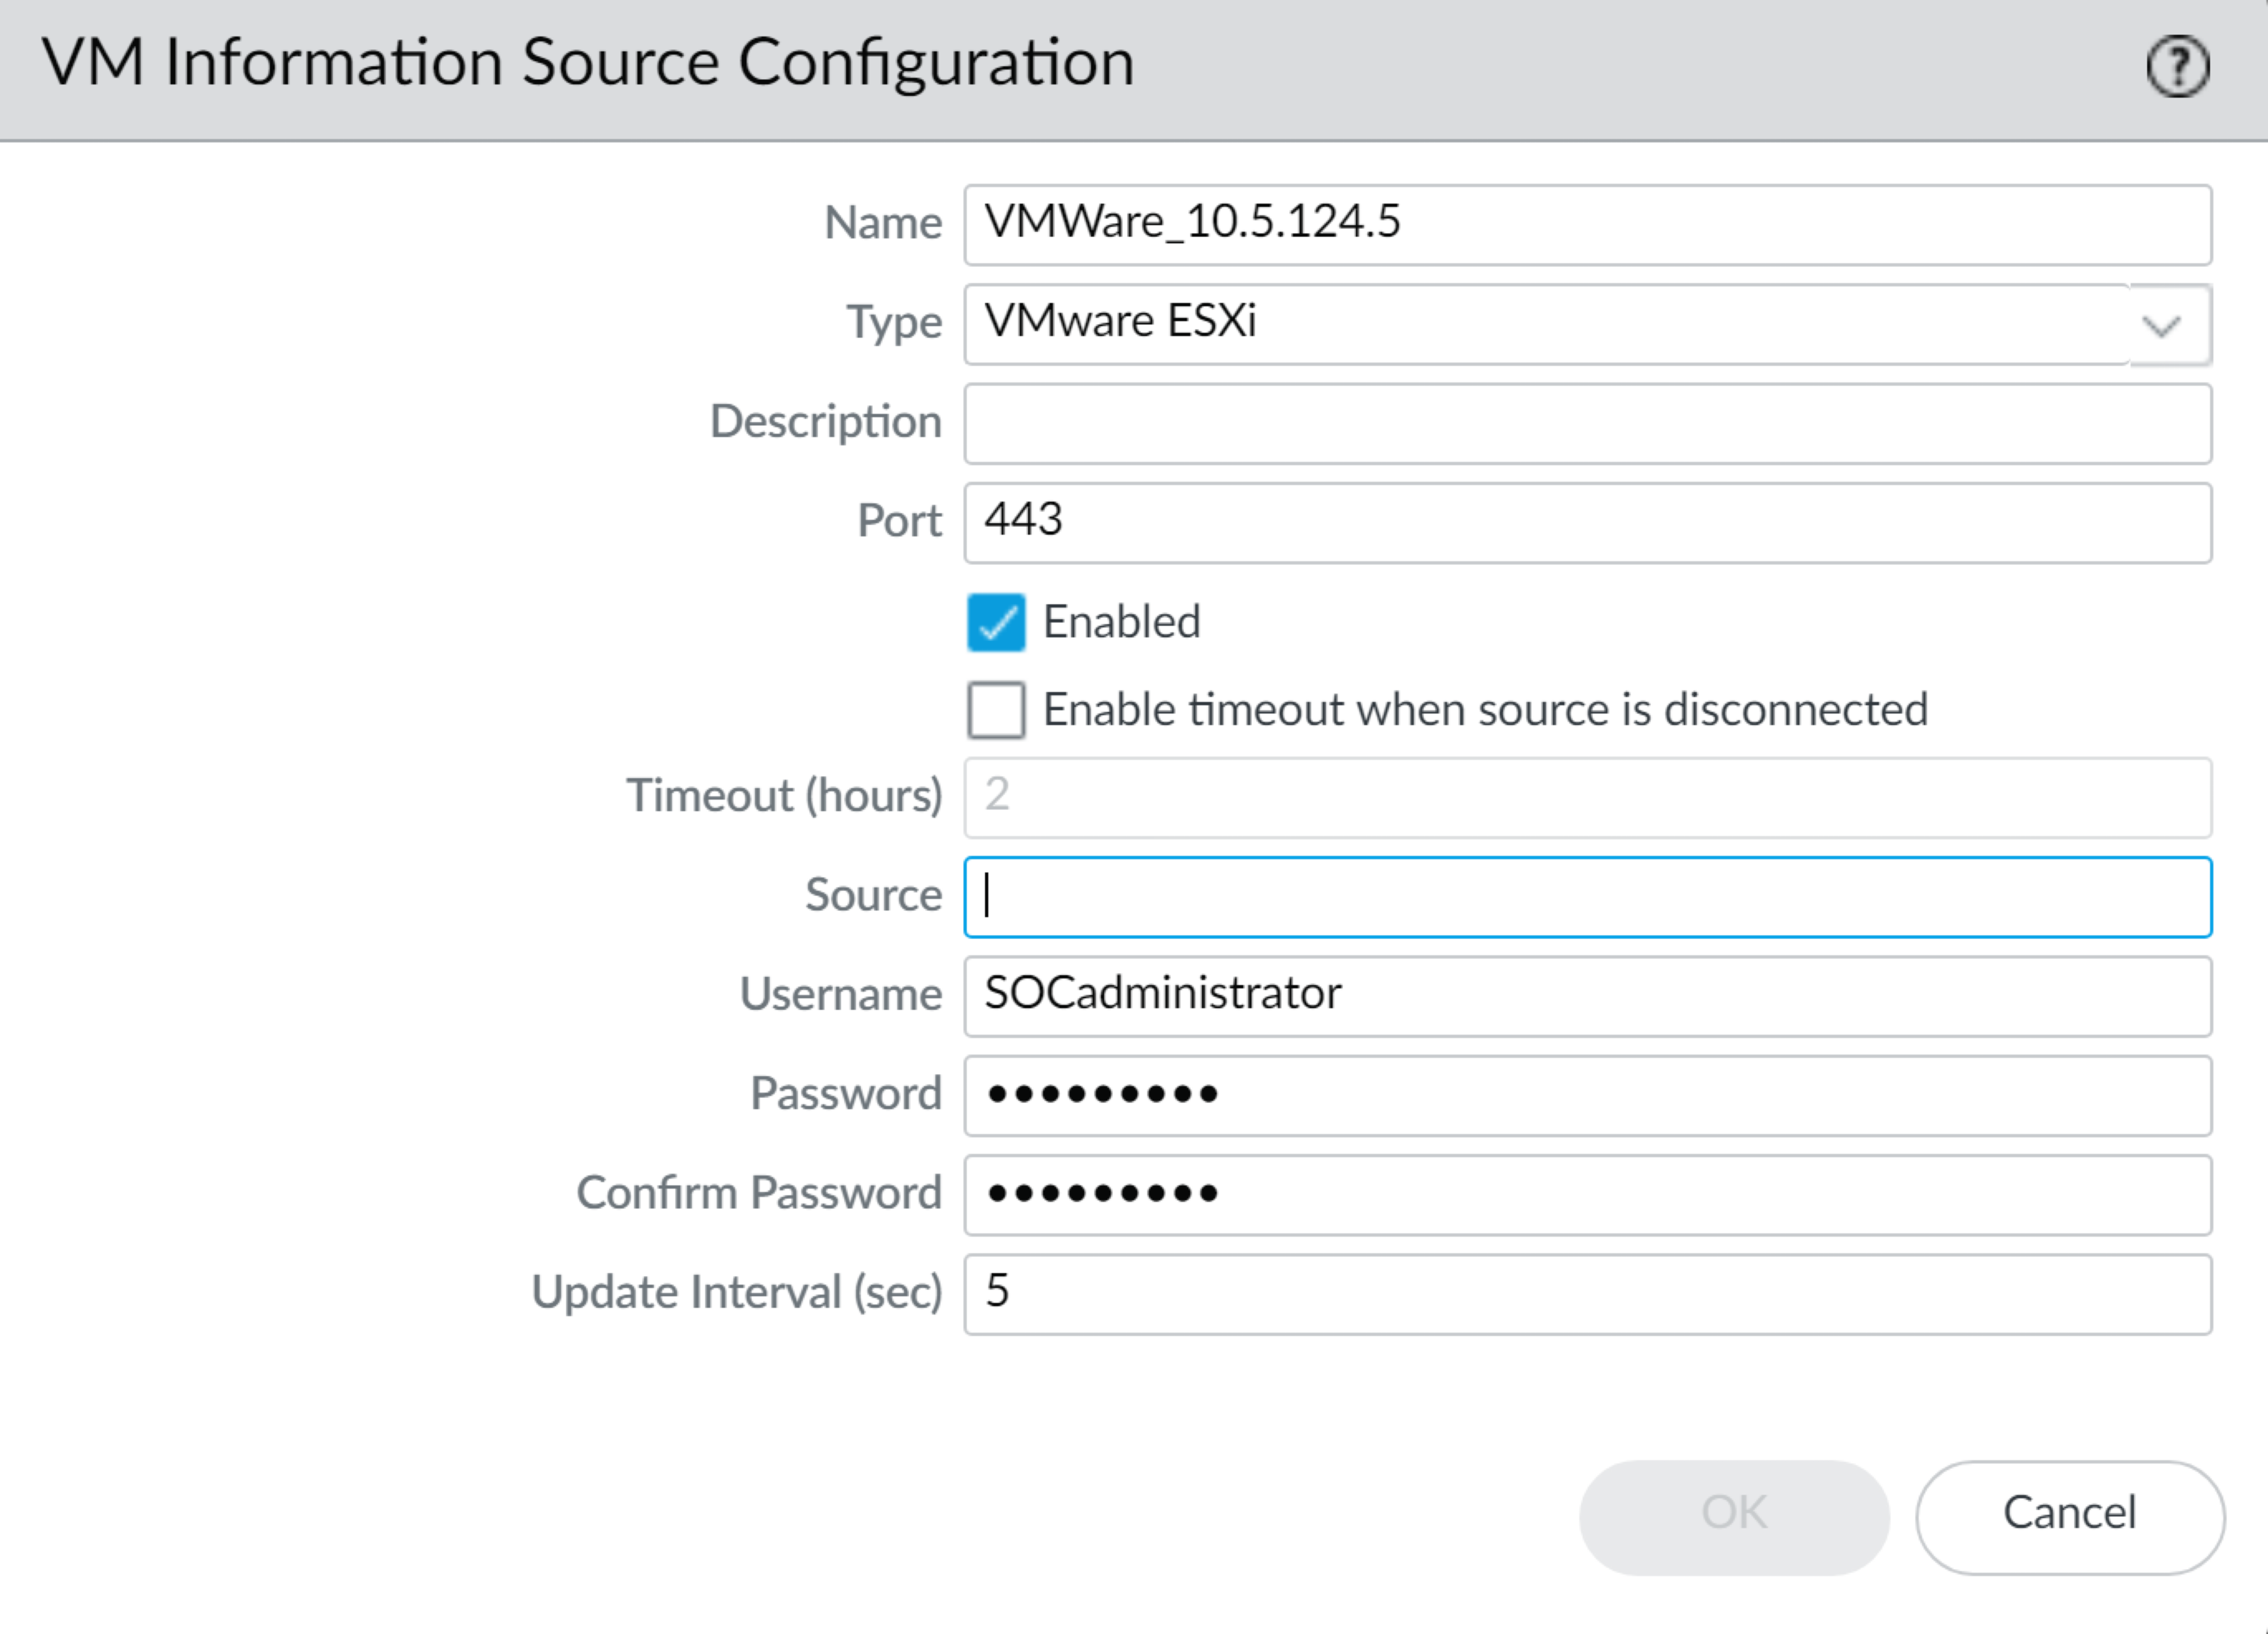
- Select DeviceVM Information Sources. This example shows you how to add VMware ESX(i) or vCenter Server.Click Add and enter the following information:
- A Name to identify the source that you want to monitor.
- Select the Type to indicate whether the source is an AWS VPC, a Google Compute Engine instance, a VMware ESX(i) server, or a VMware vCenter Server.The type chosen determines the fields displayed.
- Enter the Port on which the source is listening.
- To change the default value, select the check box to Enable timeout when the source is disconnected and specify the value. When the specified limit is reached or if the host cannot be accessed or does not respond, the firewall will close the connection to the source.
- Add the credentials (Username and Password) to authenticate to the server specified above.
- Define the Source—hostname or IP address.
- (Optional) Modify the Update interval to a value between 5-600 seconds. By default, the firewall polls every 5 seconds. The API calls are queued and retrieved within every 60 seconds, so updates may take up to 60 seconds plus the configured polling interval.
![]()
- Click OK, and Commit the changes.
- Verify that the connection Status displays as connected.
Verify the connection status.Verify that the connection Status displays as connected.If the connection status is pending or disconnected, verify that the source is operational and that the firewall is able to access the source. If you use a port other than the MGT port for communicating with the monitored source, you must change the service route (DeviceSetupServices, click the Service Route Configuration link and modify the Source Interface for the VM Monitor service).

