Prisma Browser
Digest Prisma Browser Home Screen Highlights
Table of Contents
Expand All
|
Collapse All
Prisma Browser Docs
Digest Prisma Browser Home Screen Highlights
Use the Prisma Browser Overview dashboard to deep dive into statistics about your
enterprise browser users and associated events.
| Where Can I Use This? | What Do I Need? |
|---|---|
|
|
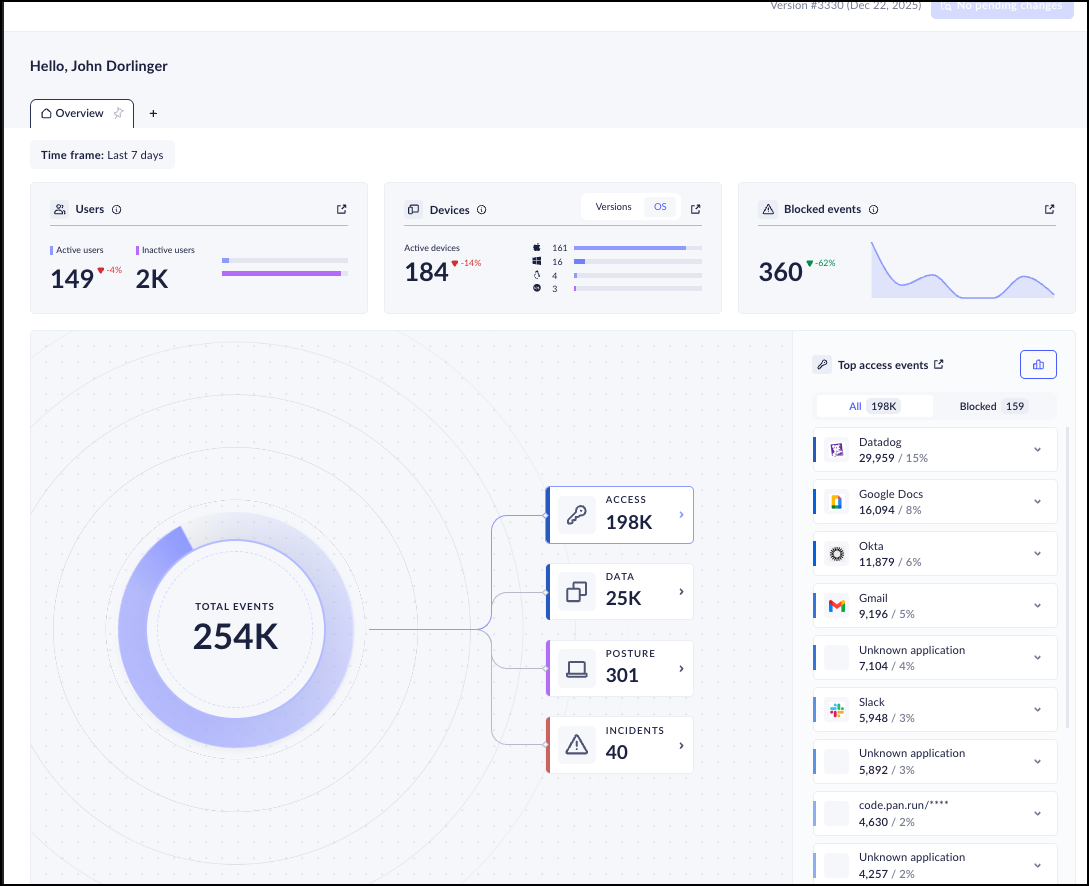
The Prisma Browser Overview dashboard serves as the landing page for the Prisma Browser administration. This dashboard gives you insights into the Prisma Browser users and devices, as well as events. From here, you can deep
dive into the data to investigate incidents and identify trends.
Monitor Users
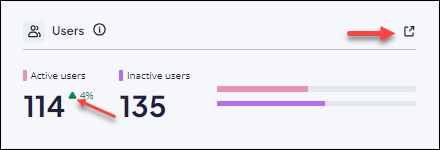
The Users section displays a breakdown of active and inactive users.
- Active users—Users who have used the Prisma Browser during the
selected Time frame. The displayed trend compares the
number of Active users in the current Time frame with
the number of Active users in the previous Time
frame. As a result of this, the trend can fluctuate daily. An
upwards trend is displayed in green, while a downward trend is displayed in
red.
![]()
- Inactive users—Users who have not used the Prisma Browser during the selected Time frame.
Expand the widget to show the Users directory page so that you can search for
specific users. From there, you can see which groups each user belongs to, which
devices belong to each user, and what policy rules associated with the user.
Monitor Devices
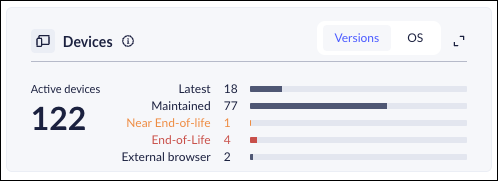
The Devices section displays the number of devices within your organization that
are using the Prisma Browser. You can see the breakdown of usage by
OS or by Version. The
Version view indicates the devices with the latest
browser version, a maintained browser version, a browser version approaching
End-of-Life, and a browser version that has reached its end of life.
Click into the display to see a more detailed version of the information, along
with the ability to adjust the Time frame, and the
browser type (Desktop browser, Mobile browser). This provides a better view of
the trends. In addition, you can get a better image of when each browser version
expired. Upwards trends show in green, while a downward trend shows in red.
Click the icon to open the Devices directory so that you can search for specific
devices. You can drill down to see which device groups include the user.

Monitor Blocked Events
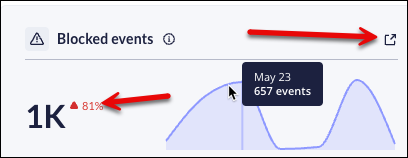
The Blocked events section displays a line chart showing the trend in blocked
events over all the users connected to the Prisma Browser. These events
include incidents and other policy-generated events within the specified
Time frame. Hover over the chart to see the number of
blocked events per day (or per hour in the case of 24-hour time frames). The
longer the time frame, the higher the granularity of the chart.
The displayed trend compares the number of blocked devices detected during the
current time frame with the number of blocked events detected during the
previous time frame. As a result, the trend can fluctuate. Upward trends show in
red and downward trends show in green.
Click the icon to open the Investigate Prisma Browser Events page, which
shows blocked and blocked encrypted events. You can use this to search for
specific blocked events. Use the Events log to filter and sort for different
parameters.
Monitor Events
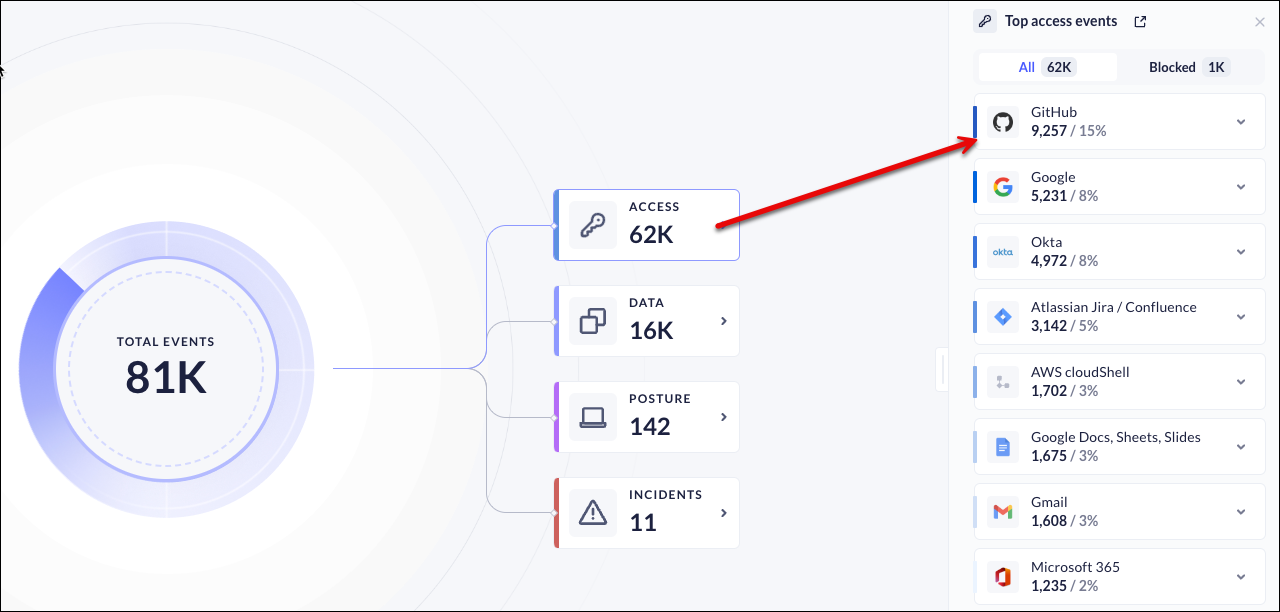
- Access events—Access events display the information regarding the applications/URLs that Prisma Browser users are using most.
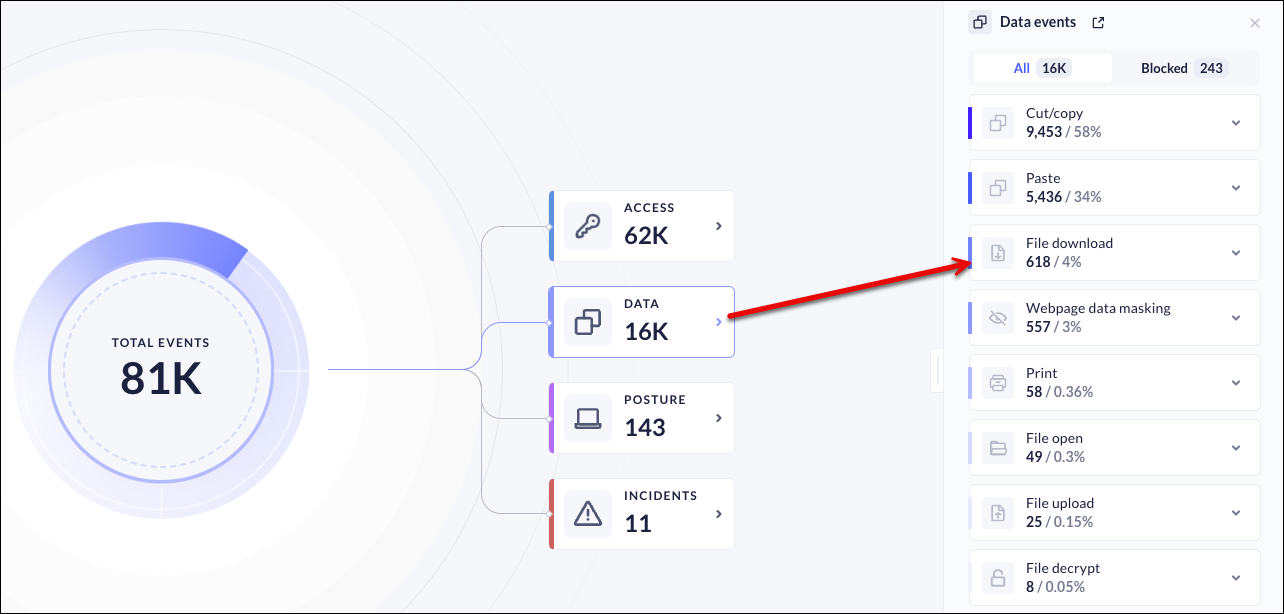
- Data events—Data events display the information regarding the operations that Prisma Browser perform most on data, such as copy, paste, download, or print.
- Posture events—Represent non-compliant sign-in issues.
- Incidents—Represent malicious events. Click on an event to open the event log so you can see the type of event and the associated user.
You can deep-dive into the data for each type of event.
- Deep Dive into Access Events
- Select the Access category from the Total Events part of the screen.
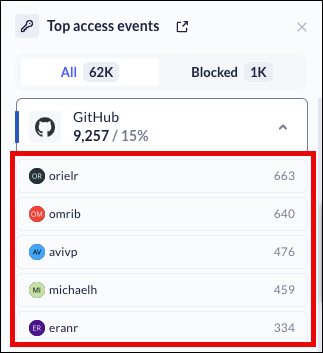
![]() Click into one of the applications or URLsFrom here, you can see which users are having the most interactions with the selected application.
Click into one of the applications or URLsFrom here, you can see which users are having the most interactions with the selected application.![]() To see application events for a specific user in the Events log, click on the user name.To help you investigate access activities for the selected user, this view automatically filters on:
To see application events for a specific user in the Events log, click on the user name.To help you investigate access activities for the selected user, this view automatically filters on:- Time frame
- Type, which includes the following additional filters:
- Website access
- Login attempts
- Login failed
- User
- User
- Application
![]() Deep dive into data events.
Deep dive into data events.- Select the Data category from the Total Events part of the screen.
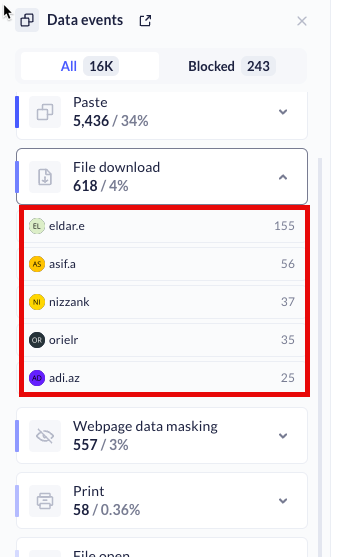
![]() Click into one of the data events.From here, you can see which users are using the selected data operation most frequently.
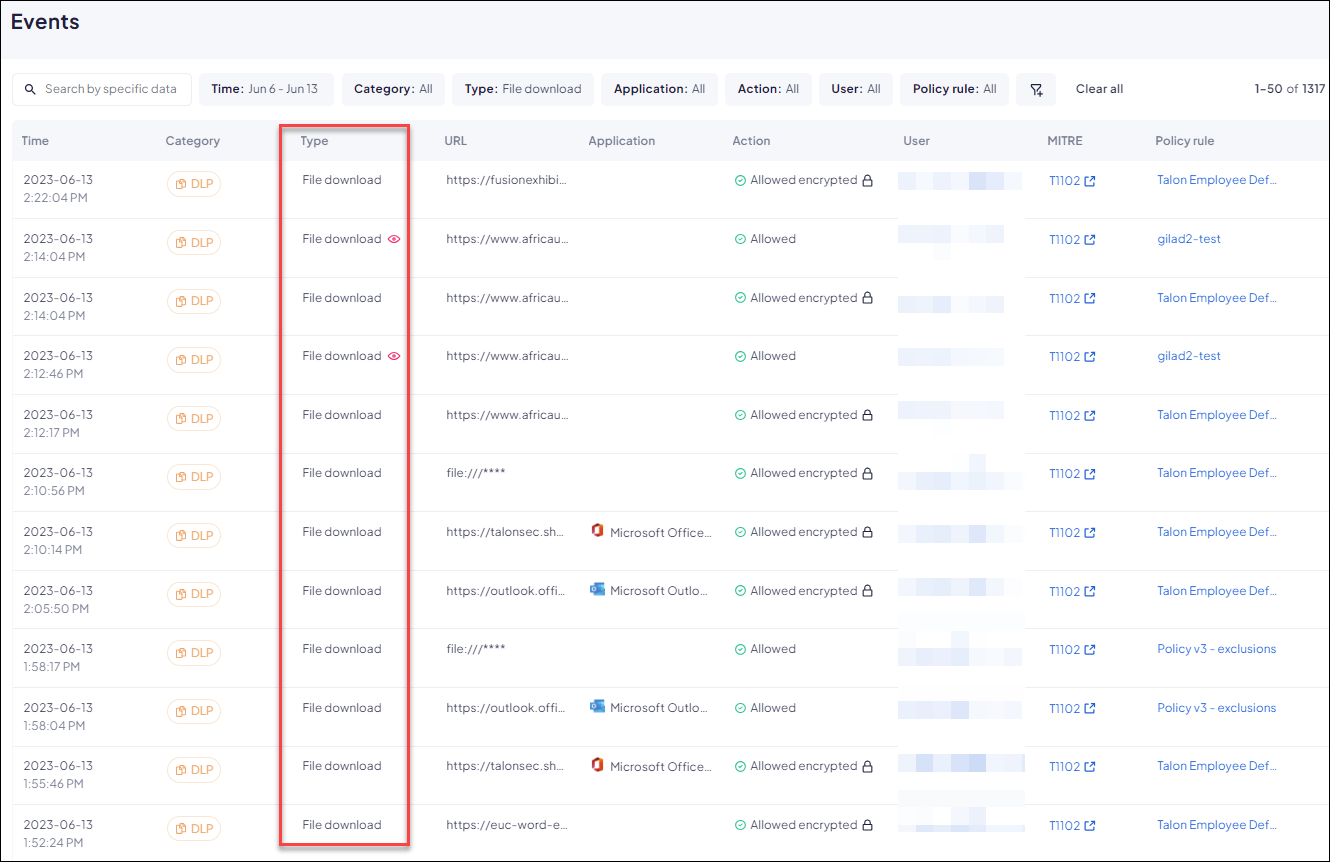
Click into one of the data events.From here, you can see which users are using the selected data operation most frequently.![]() To see data events for a specific user in the Events log, click on the user name.
To see data events for a specific user in the Events log, click on the user name.![]() Deep dive into posture events.
Deep dive into posture events.- Select the Posture category from the Total Events part of the screen and then click into one of the posture events.From here, you can see details about non-compliant sign-in events that Prisma Browser blocked based on the device group settings.
![]() To drill into specific posture events, select an OS platform and then select a particular user.To help you investigate posture events for the selected user, this view automatically filters on:
To drill into specific posture events, select an OS platform and then select a particular user.To help you investigate posture events for the selected user, this view automatically filters on:- Time frame
- Type: Non-compliant sign-in
- User
- OS platform
![]()

