Strata Cloud Manager
Dashboard: Build a Custom Dashboard
Table of Contents
Expand All
|
Collapse All
Strata Cloud Manager Docs
Dashboard: Build a Custom Dashboard
Create and customize dashboards to get visibility into areas of interest in your
network.
| Where Can I Use This? | What Do I Need? |
|---|---|
|
Each of these licenses include access to Strata Cloud Manager:
The other licenses and prerequisites needed for visibility
are:
→ The features and capabilities available to you in Strata Cloud Manager depend on which license(s) you are
using.
|
Apart from the default dashboards, you can create custom dashboards to get visibility into areas
of your interest in your network using widgets. Widgets are components used to
create a dashboard. Widgets are categorized and stored in the widget library. Click Dashboards+ and select a category from the drop down list to view the widgets.
The widgets available in the widget library depend on your security services
subscriptions. For example, if you have AIOps for NGFW Premium and
Advanced WildFire licenses, you can view and use all the widgets
under WildFire category to create dashboard.
These are the widget categories available to create a dashboard. Refer to the links
below to know the license requirements to access widgets under these categories and
learn about them.
Create a Dashboard
You can add up to 10 widgets in a custom dashboard
and create 10 custom dashboards per user. The dashboard and widgets can be
customized at any time. You can customize the widget tile, description, show or
hide filters, dashboard settings such as layout, dashboard name, and
descriptions, and also include filters in the dashboard.
- Click Dashboards+.
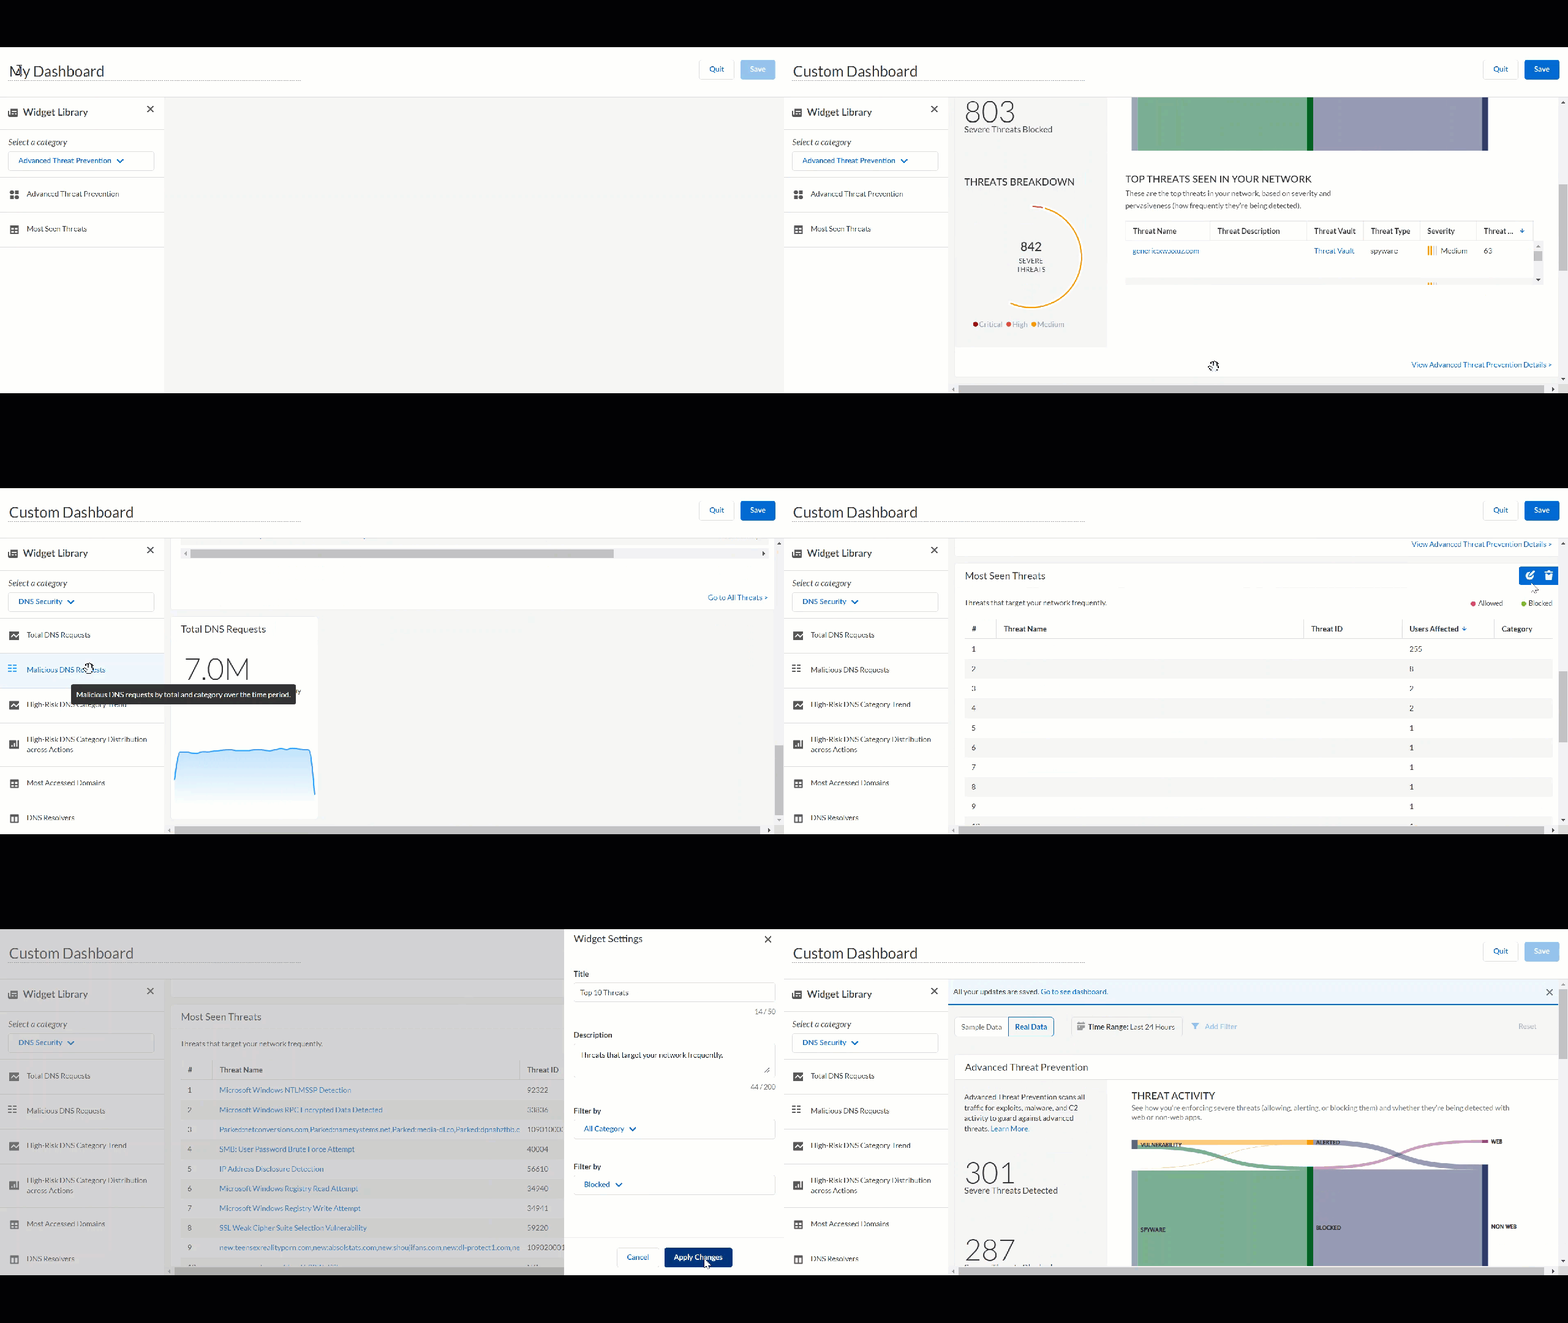
![]() Enter a name for the dashboard.Select a widget category from the Widget Library drop-down.Add the widget to the dashboard: Hover over the widget to learn about the widget. Drag and drop the widget to the dashboard canvas.You can add more widgets of the same or different types from another widget category to the dashboard canvas.Switch between the Sample Data and Real Data view to know how your dashboard widget looks. Sample data helps you visualize how your dashboard will look and what type of information you can see. Use the Real Data option to view the actual data for your deployment.(Optional) You can customize the dashboard in the editor view:
Enter a name for the dashboard.Select a widget category from the Widget Library drop-down.Add the widget to the dashboard: Hover over the widget to learn about the widget. Drag and drop the widget to the dashboard canvas.You can add more widgets of the same or different types from another widget category to the dashboard canvas.Switch between the Sample Data and Real Data view to know how your dashboard widget looks. Sample data helps you visualize how your dashboard will look and what type of information you can see. Use the Real Data option to view the actual data for your deployment.(Optional) You can customize the dashboard in the editor view:- Rearrange the widgets in the dashboard - select the widget and drag and drop where required in the canvas.
- Edit a widget using the edit icon at the top-right corner of each
widget. Editable settings vary by widget type — for example, name,
description, and data filtering options like verdict and action.
You can edit the widget settings in the editor view or after you save the dashboard.
Save the dashboard and click Go to see dashboard at the top of the page to open the dashboard.(Optional) After you save the dashboard, you can:- change the time range for which you want to view the dashboard data.You can change the time only after you save the dashboard. In the editor view, the time range defaults to 24 hours.
- use the edit or delete icon to modify or delete the custom dashboard.
![]()


