Strata Cloud Manager
Dashboard: Advanced Threat Prevention
Table of Contents
Expand All
|
Collapse All
Strata Cloud Manager Docs
-
- Strata Copilot
- Command Center: Strata Cloud Manager
-
- Dashboard: Build a Custom Dashboard
- Dashboard: Executive Summary
-
- WildFire Dashboard: Filters
- WildFire Dashboard: Total Samples Submitted
- WildFire Dashboard: Analysis Insights
- WildFire Dashboard: Session Trends For Samples Submitted
- WildFire Dashboard: Verdict Distribution
- WildFire Dashboard: Top Applications Delivering Malicious Samples
- WildFire Dashboard: Top Users Impacted By Malicious Samples
- WildFire Dashboard: Top Malware Regions
- WildFire Dashboard: Top Firewalls
- Dashboard: DNS Security
- Dashboard: AI Runtime Security
- Dashboard: IoT Security
- Dashboard: Prisma Access
-
- Application Experience Dashboard: Mobile User Experience Card
- Application Experience Dashboard: Remote Site Experience Card
- Application Experience Dashboard: Experience Score Trends
- Application Experience Dashboard: Experience Score Across the Network
- Application Experience Dashboard: Global Distribution of Application Experience Scores
- Application Experience Dashboard: Experience Score for Top Monitored Sites
- Application Experience Dashboard: Experience Score for Top Monitored Apps
- Application Experience Dashboard: Application Performance Metrics
- Application Experience Dashboard: Network Performance Metrics
- Dashboard: Best Practices
- Dashboard: Compliance Summary
-
- Prisma SD-WAN Dashboard: Device to Controller Connectivity
- Prisma SD-WAN Dashboard: Applications
- Prisma SD-WAN Dashboard: Top Alerts by Priority
- Prisma SD-WAN Dashboard: Overall Link Quality
- Prisma SD-WAN Dashboard: Bandwidth Utilization
- Prisma SD-WAN Dashboard: Transaction Stats
- Prisma SD-WAN Dashboard: Predictive Analytics
- Dashboard: PAN-OS CVEs
- Dashboard: CDSS Adoption
- Dashboard: Feature Adoption
- Dashboard: On Demand BPA
- Manage: IoT Policy Recommendation
- Manage: Enterprise DLP
- Manage: SaaS Security
- Manage: Prisma Access Browser
- Reports: Strata Cloud Manager
-
-
- Strata Cloud Manager Release Information
-
- New Features in February 2025
- New Features in January 2025
- New Features in December 2024
- New Features in November 2024
- New Features in October 2024
- New Features in September 2024
- New Features in August 2024
- New Features in July 2024
- New Features in June 2024
- New Features in May 2024
- New Features in April 2024
- New Features in March 2024
- New Features in February 2024
- New Features in January 2024
- New Features in November 2023
- New Features in October 2023
- New Features in September 2023
- Known Issues
- Addressed Issues
- Getting Help
Dashboard: Advanced Threat Prevention
Get insight into threats detected in your network and identify opportunities to
strengthen your security posture.
Where Can I Use This? | What Do I Need? |
---|---|
|
Each of these licenses include access to Strata Cloud Manager:
The other licenses and prerequisites needed for visibility
are:
→ The features and capabilities available to you in Strata Cloud Manager depend on which license(s) you are
using.
|
- Click Strata Cloud ManagerDashboardsMore DashboardsAdvanced Threat Prevention to get started.
What does this dashboard show you?
The dashboard shows aggregated data per Strata Logging Service
tenant.
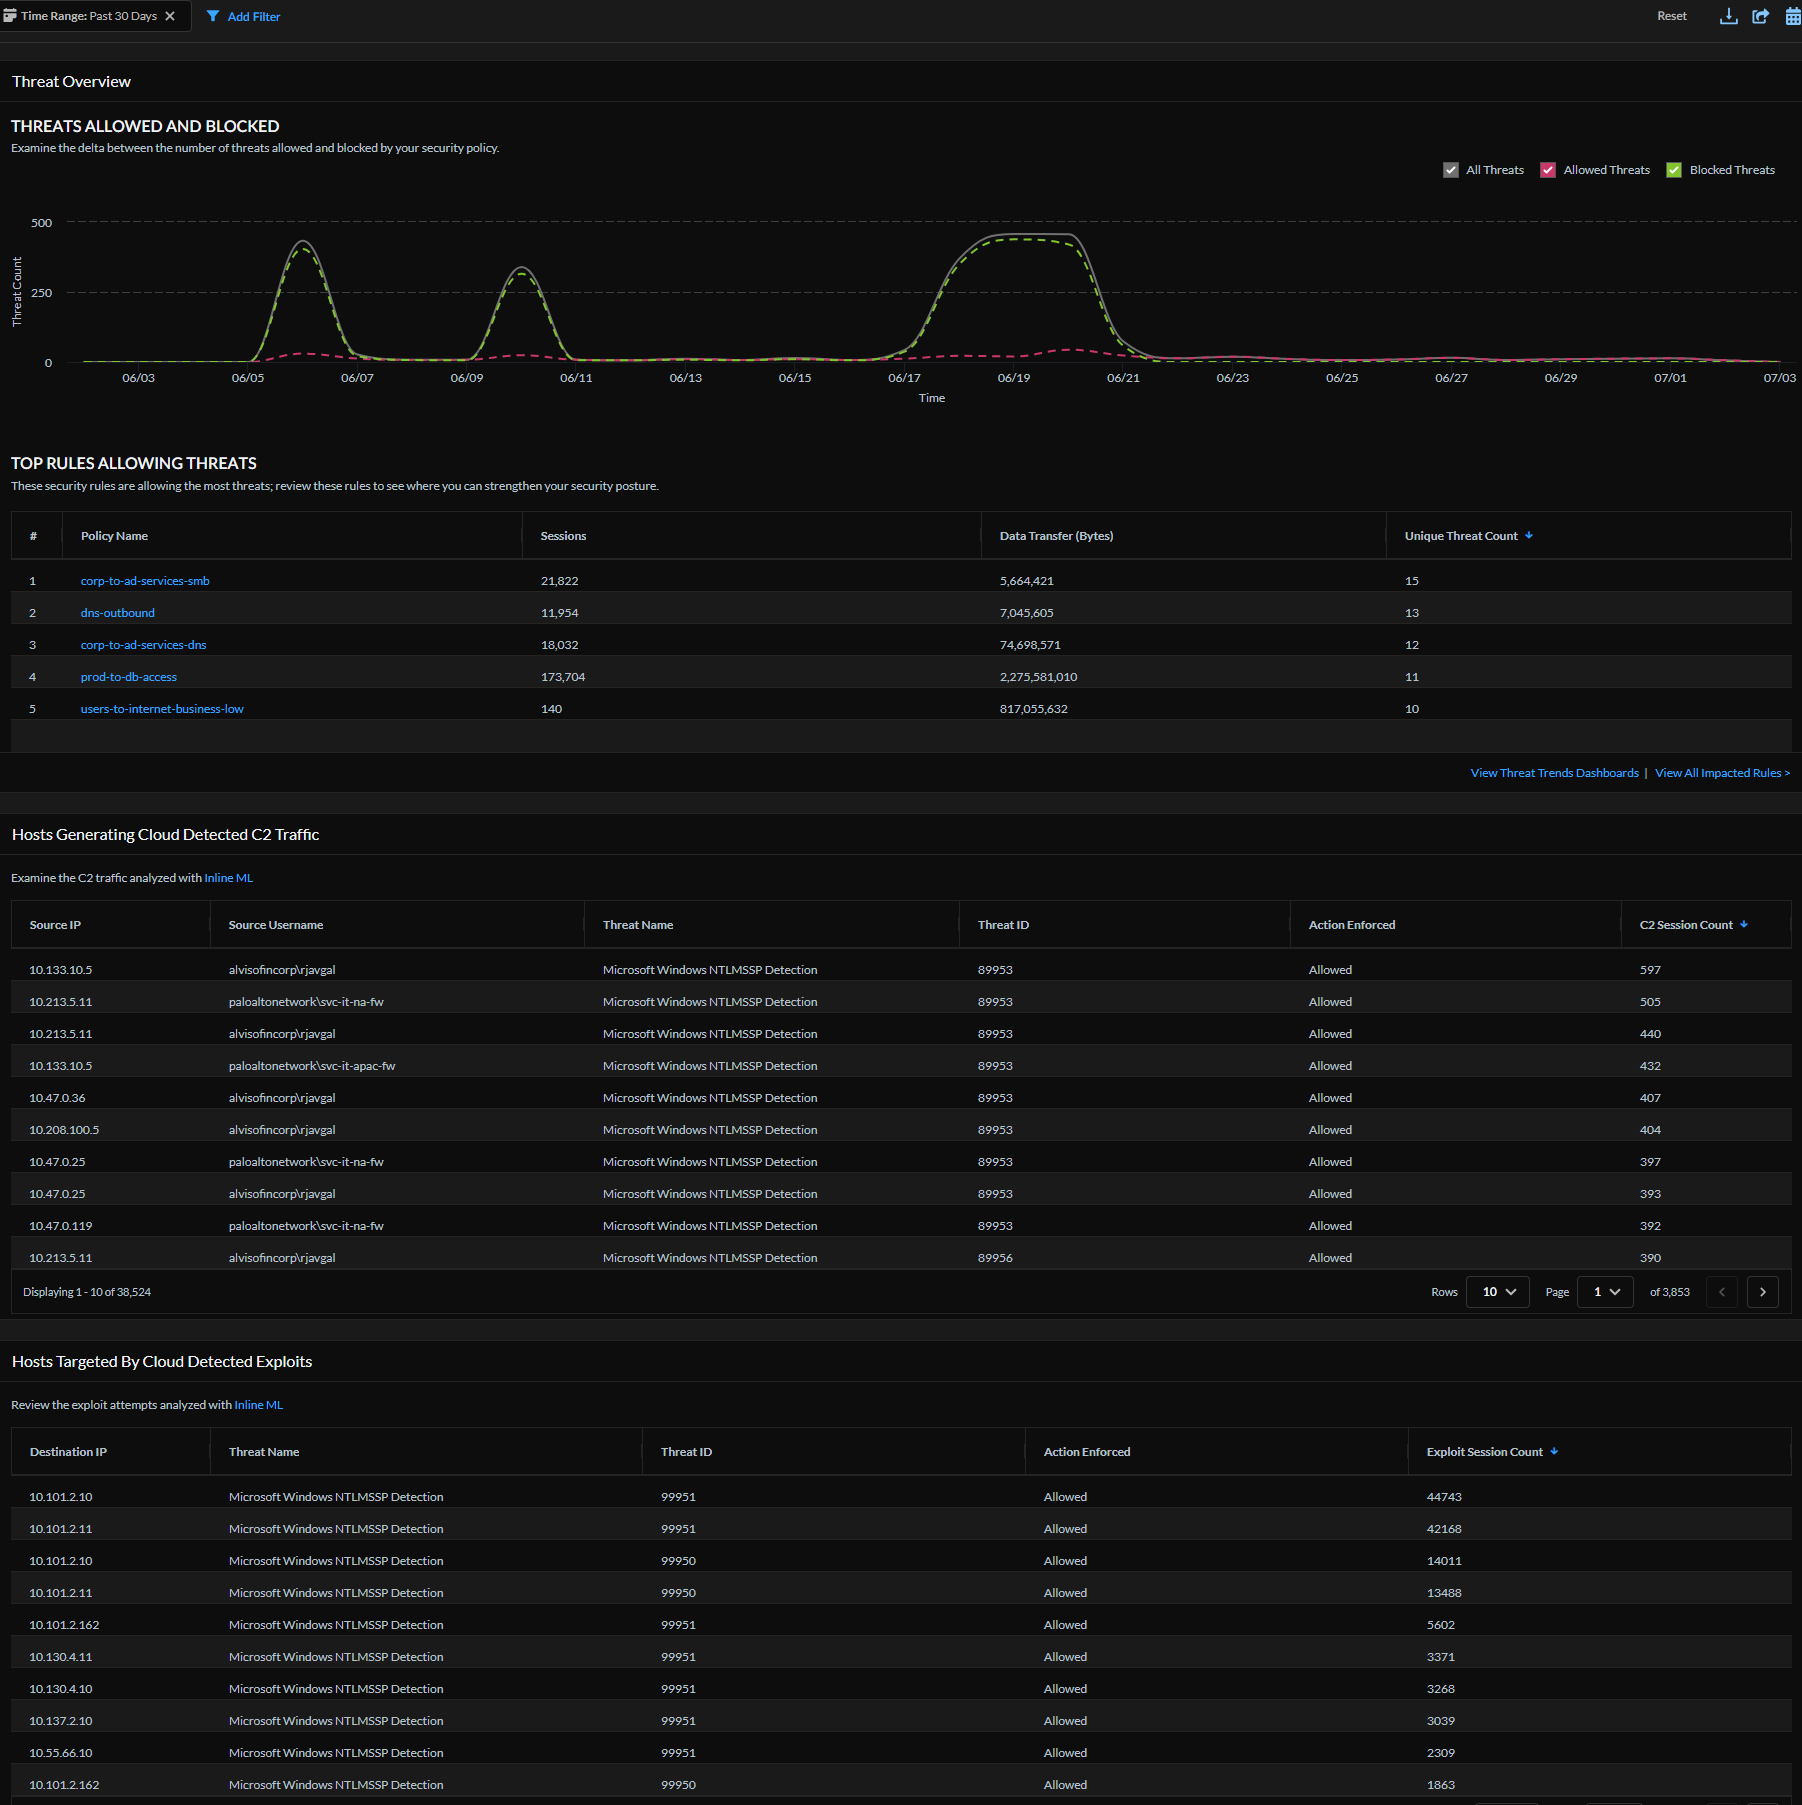
The Advanced Threat Prevention dashboard gives insight into threats
detected in your network and identifies opportunities to strengthen your
security posture. Threats are detected using inline cloud analysis models and threat signatures generated from
malicious traffic data collected from various Palo Alto Networks services. This
dashboard provides a timeline view of threats allowed and blocked and a list of
hosts generating cloud-detected C2 traffic and hosts targeted by cloud-detected
exploits.
This dashboard supports reports. These icons,
in the top right of a dashboard indicate that
reports are supported for this dashboard. You can share, download, and schedule
reports that cover the data this dashboard displays.
How can you use the data from dashboard?
Use this dashboard to:
- get threat visibility in your network traffic
- analyze threat sessions to improve the accuracy of your policy rules
- gain insight into the real-time threat detected by inline cloud analysis
- get context around the threat from logs and cloud reports and use this data to improve your incident response process.