View the health of all your Prisma Access locations for your remote networks and
mobile users.
Where Can I Use
This?
What Do I Need?
Prisma Access
(with Strata Cloud Manager or Panorama
configuration management)
Prisma Access license
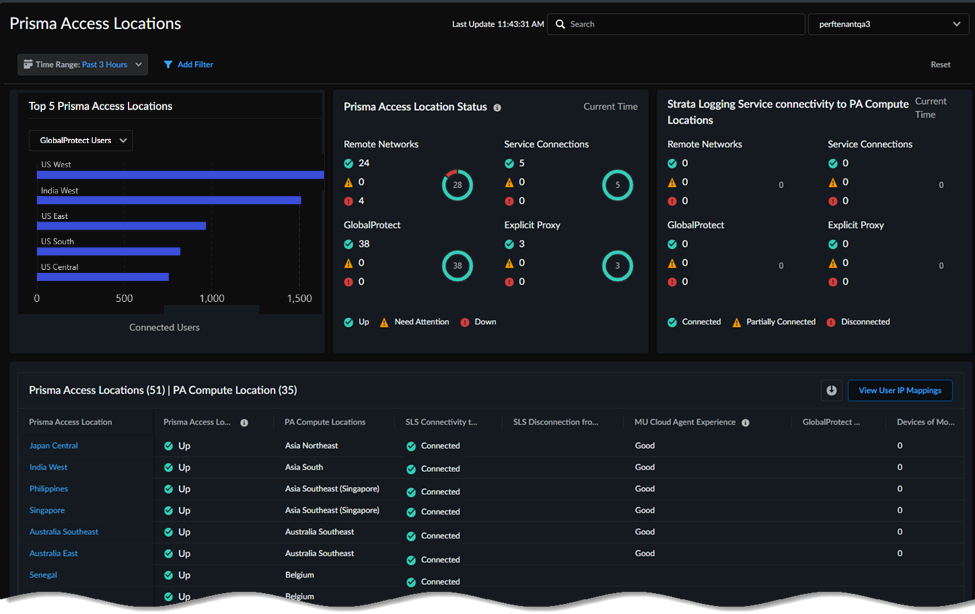
Select InsightsPrisma SASEPrisma Access Locations to get started. From here, you can view the health of all your Prisma
Access locations for your remote networks and mobile users.
It also shows the compute locations that correspond to the
locations you have onboarded.
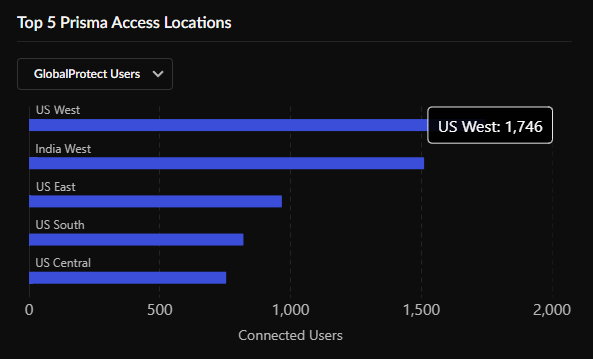
Top 5 Prisma Access Locations
The bars show data about the Top 5 Prisma Access locations for remote networks,
service connections, GlobalProtect™ mobile users, or Explicit Proxy mobile users,
based on the total bandwidth consumed during the selected time range. Hover over any
bar to see how many users are in that particular location.
Prisma Access Location Status
Depending on your license, this widget shows the number of connected remote network
sites, service connection sites, unique GlobalProtect users, and unique explicit
proxy users logged in to Prisma Access. The widget's pie charts are based on how
many remote networks, service connections, GlobalProtect users, and Explicit Proxy
users are in the following status:
Up (green)—All cloud firewalls for this Prisma Access location are Up.
Down (red)—All cloud firewalls for this Prisma Access location are Down.
Need Attention (orange)—Some cloud firewalls for this
Prisma Access location are Up and some are Down.
Strata Logging Service Connectivity to PA Compute Locations
The Strata Logging Service Connectivity to PA Compute
Locations widget gives you visibility into the Strata Logging Service connectivity health status from all your Prisma Access instances for the Strata Logging Service region that
you selected during your Prisma Access license activation.
Connected—Strata Logging Service is receiving
logs from all cloud firewalls in this compute location.
Disconnected—Strata Logging Service isn’t
receiving any logs from any of the cloud firewalls in this compute
location.
Partially Connected—Strata Logging Service is
receiving logs from some but not all of the cloud firewalls in this compute
location.
Each tenant can connect to only one Strata Logging Service instance in any region of its choice. Prisma Access polls the Strata Logging Service database every 5 minutes to check
for connectivity between the nodes (Remote Networks, Service Connections,
GlobalProtect, and Explicit Proxy) and the Strata Logging Service
database.
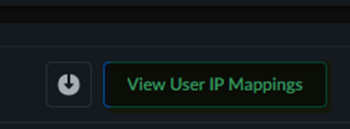
View User IP Mappings
The View User IP Mappings widget enables you to view User
ID-to-IP address mappings of the currently connected users. This widget only shows
the information of the currently connected users.
Click Users and Search
Mappings to view the username-to-IP address mapping.
Clicking the username shows the user groups that the user is a part of.
Click User Groups and Search
Mappings to view all users that are a part of a particular User
Group. Clicking the user group names shows all the currently connected users in
that group.
Prisma Access Locations and PA Compute Location
View the Prisma Access Locations status in real time.
In a specific location, if a user logs in from multiple hosts, the user is counted
as a single user, but if any user logs in from two different Prisma Access
locations by disconnecting from one and logging in from another within the time
period, the user is counted as two users. Select a location to view details, such as
bandwidth consumed, status, Strata Logging Service Connectivity, and User-ID
and group mappings.
To download this table to a .csv file, click the
Download arrow next to the View User IP Mappings button.
Field
Description
Prisma Access Location
The Prisma Access location.
Prisma Access Location Status
The status of the Prisma Access location (either
Up, Down, or
Need Attention).
The connectivity status between Strata Logging Service and
the compute location that corresponds with the selected location
(either Up, Down, or
Need Attention).
SLS Disconnection from PA Compute Locations
The number of disconnection events between Strata Logging Service and the instances in that compute
location that occurred in the selected time range selected.