Strata Cloud Manager
Insights: Status and Monitoring
Table of Contents
Insights: Status and Monitoring
View a visual representation of your PAN-OS devices.
| Where Can I Use This? | What Do I Need? |
|---|---|
|
|
Monitor the health and performance of your NGFW devices in a unified view
through . This feature facilitates a seamless transition from Panorama-based
monitoring to Strata Cloud Manager, offering a consolidated perspective of both your
NGFW and Prisma Access environments.
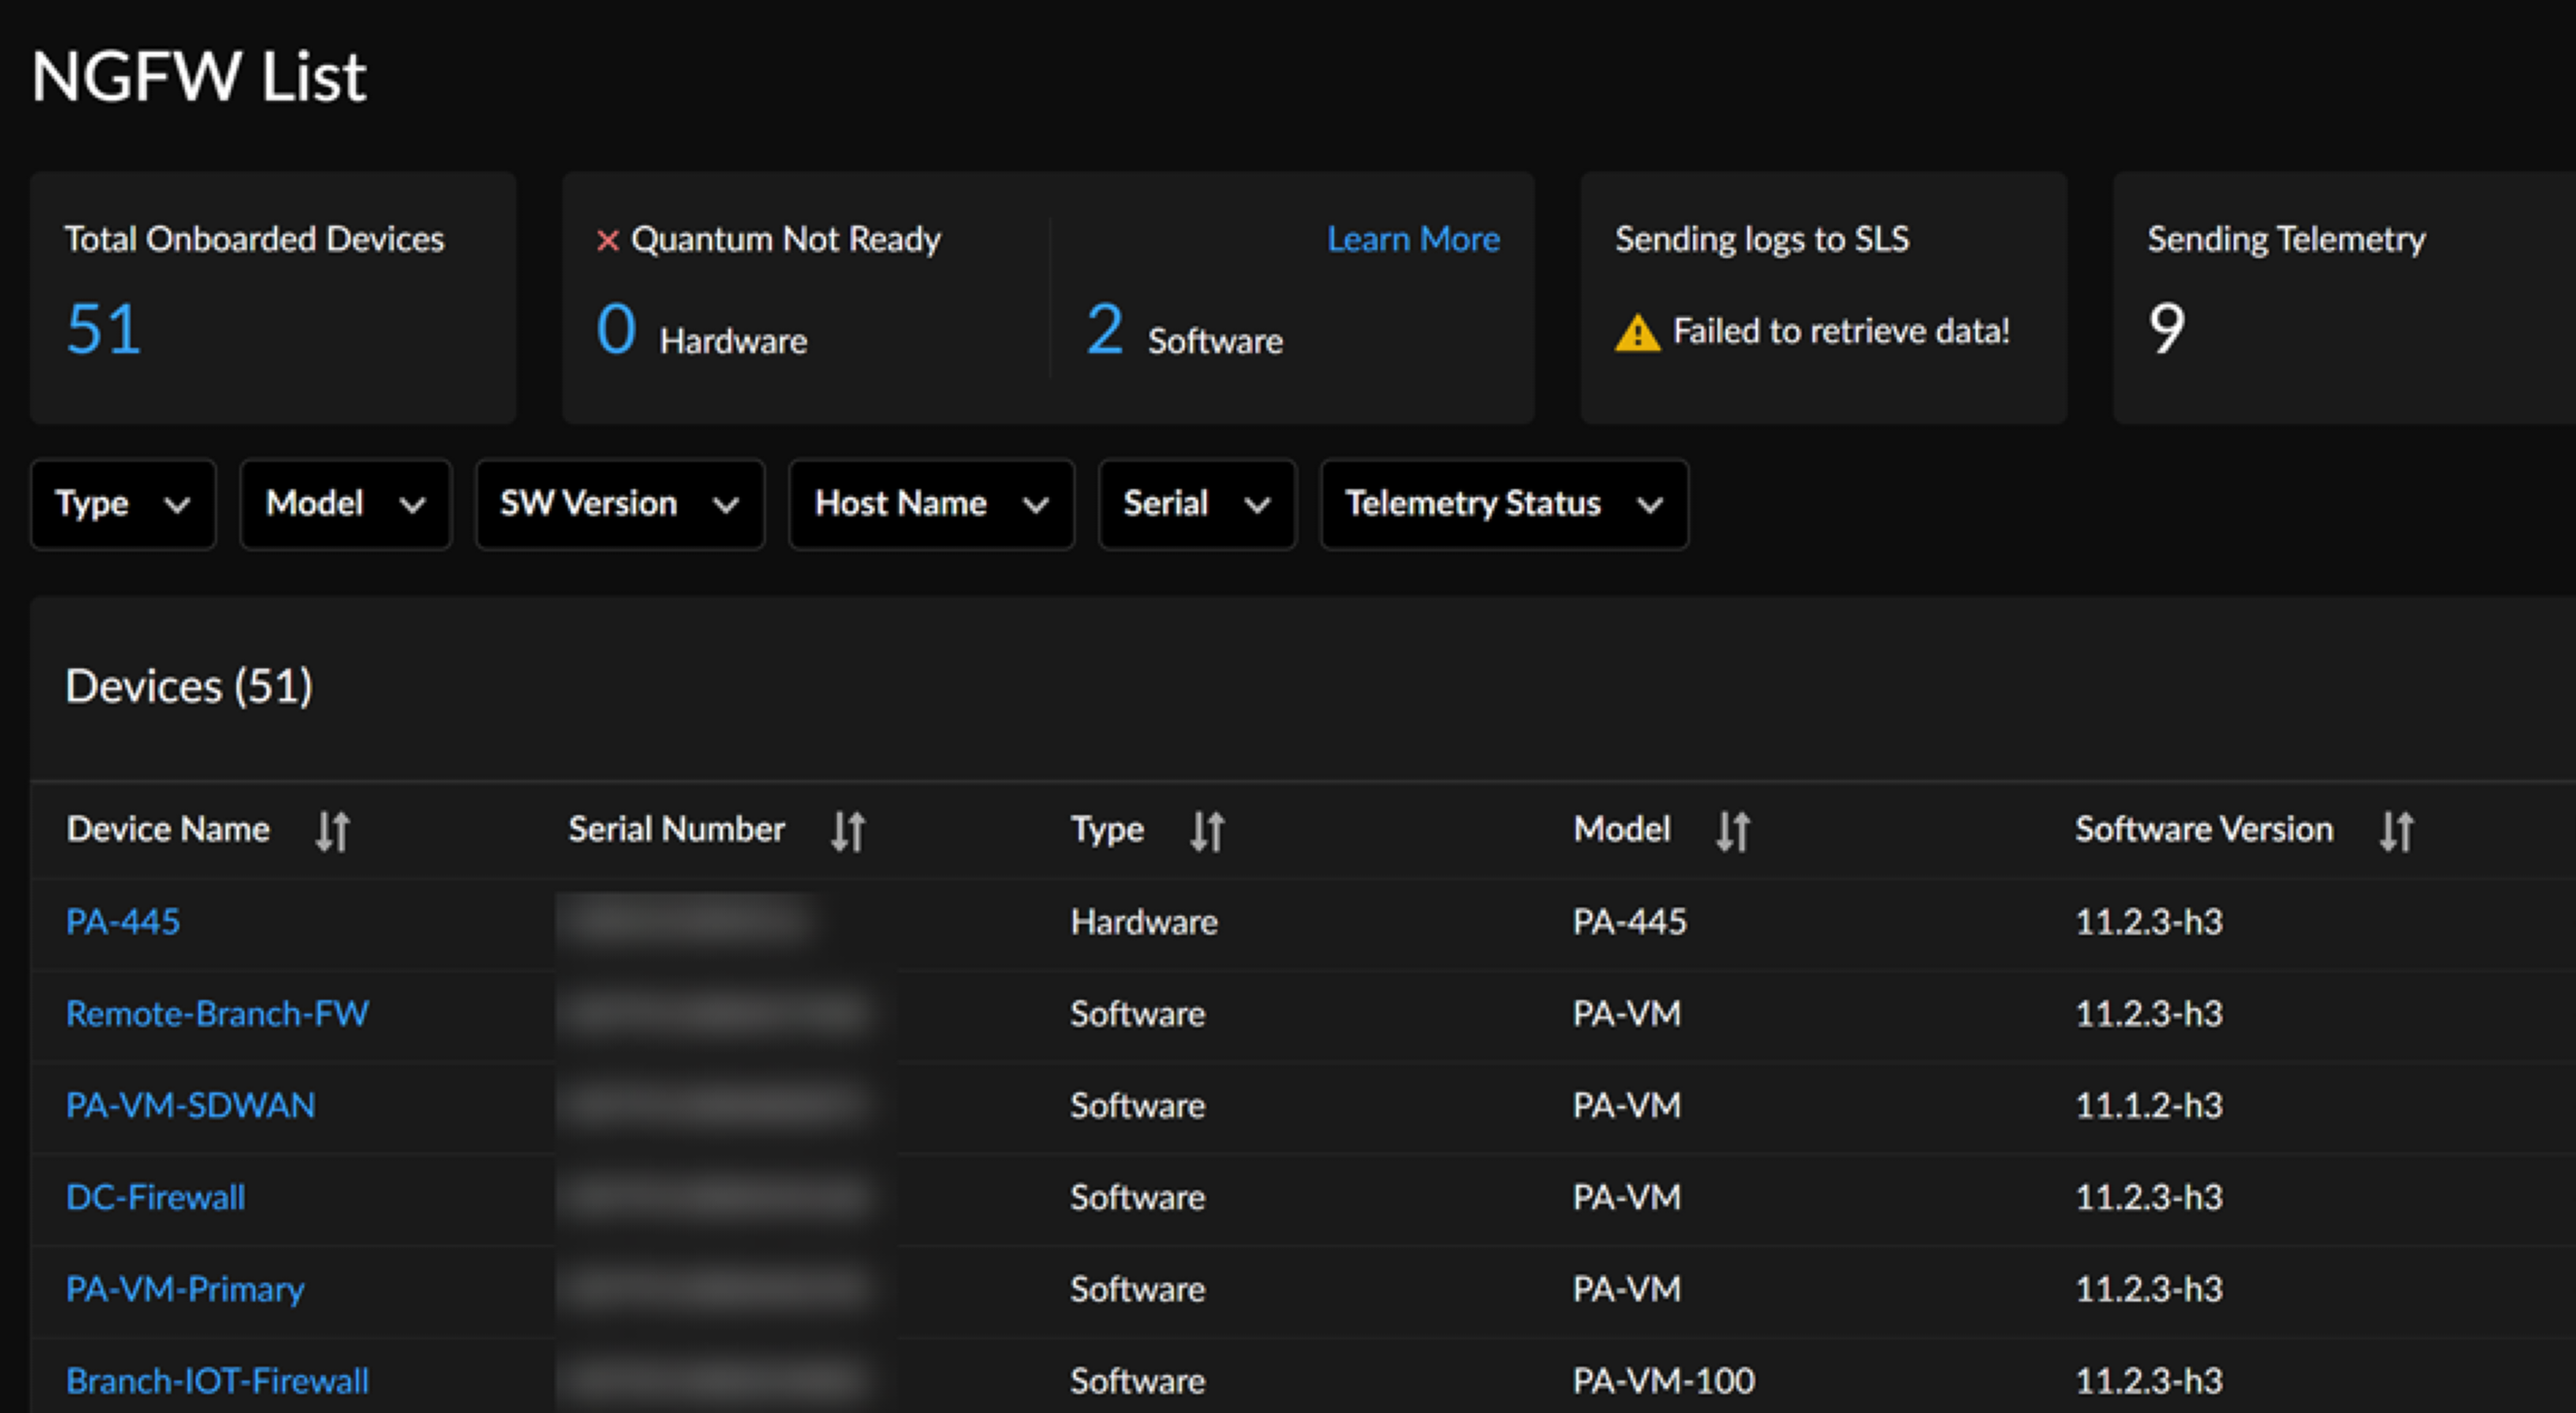
You can get an overview of your deployed devices:
- Total Onboarded Devices
- Quantum Readiness
- Sending logs to SLS
- Sending Telemetry
- with Delayed Telemetry
- Number of Models
- # of Software Versions
You can filter the devices based on their type, model, software version,
host name, serial number and telemetry status. You can also Export the list
of devices.
Toggle Quantum Readiness to view the devices that are quantum ready and not ready.
View Device Details
By selecting a device from the NGFW List visualization or
by following a link from elsewhere in the app, you can view specific details
about a firewall or Panorama appliance, such as health grade, metrics,
connections, and more.

The current health grade of the device and a chart showing its history over the
past 30<x> days. Possible health grades are Good, Fair, Poor, and
Critical.
The health grade of the device after you have addressed open alerts. This tile
also shows you the health of your overall deployment after closing alerts.
The total number of open alerts on the device.
Five of the most common alerts on this device over the past 30 days.
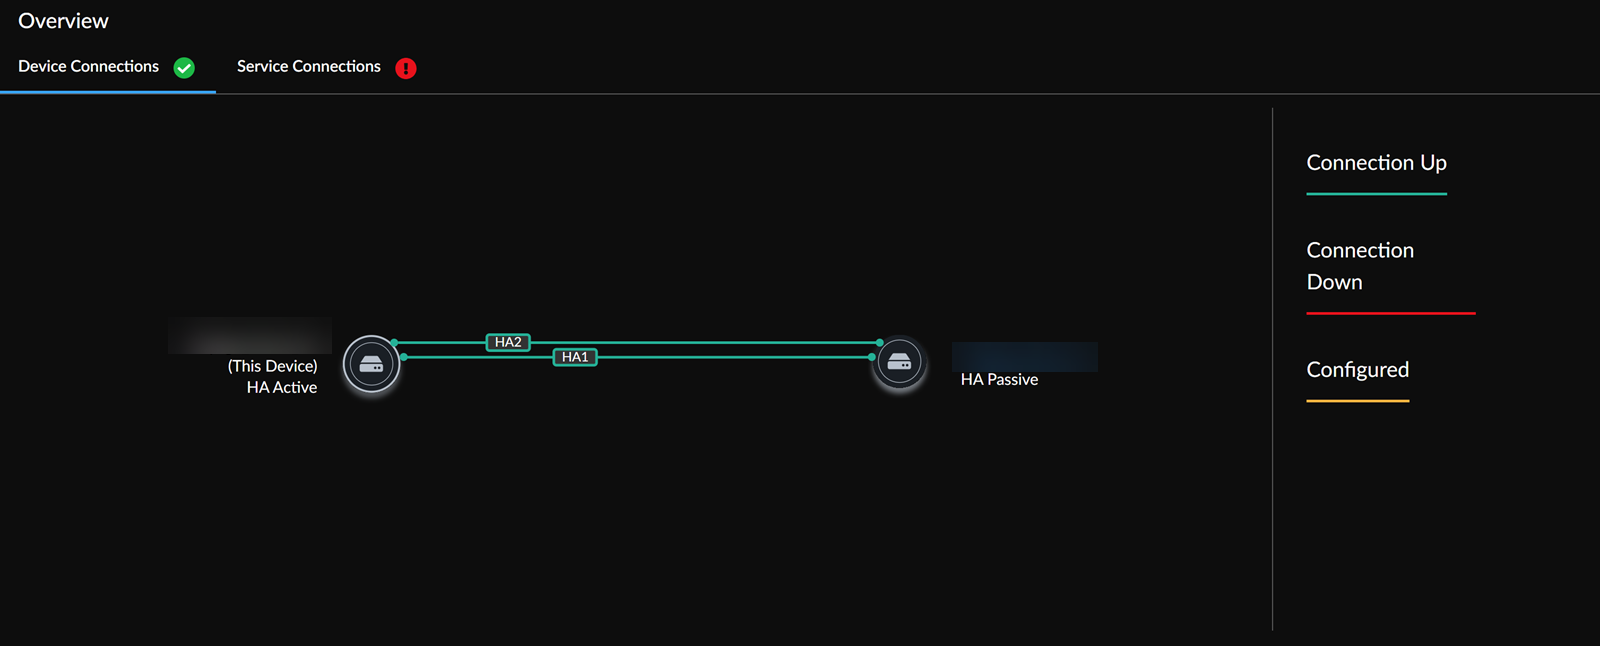
| Overview > Device Connections The other devices
connected to the one you are currently viewing. Select a
device to view its details. |
|
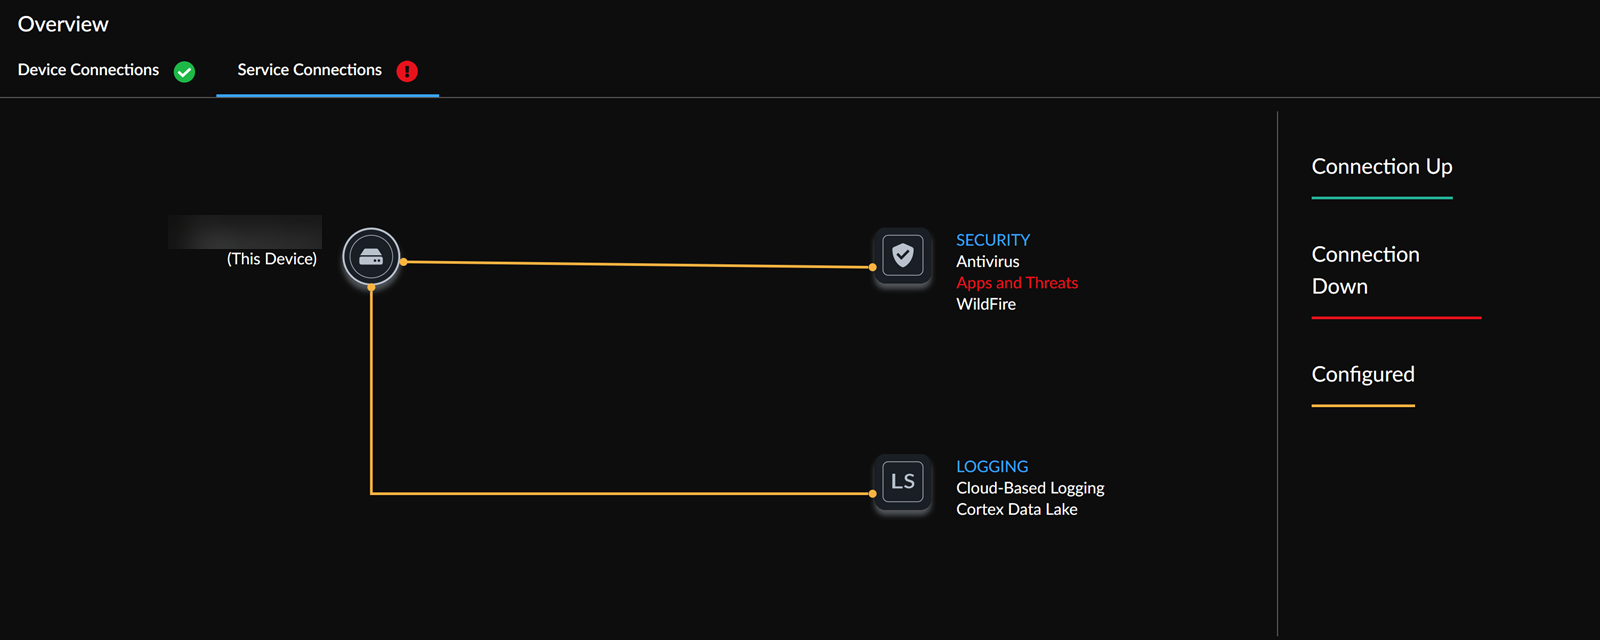
| Overview > Service Connections An overview of all
Security and Logging services integrated with the device.
Select a service to view its details. |

|
| Alert Timeline A timeline of device alerts and
commit events. Alerts are categorized as Critical, Warning,
or Commit Events. Toggle to view the alert data in table
format. |

|
| Top Alert Types for this Device The most common
alerts over the past 30 days. Select an alert to view its
alert details. |

|
| Top 10 Application Usage The ten applications using
the most data on the firewall. |

|
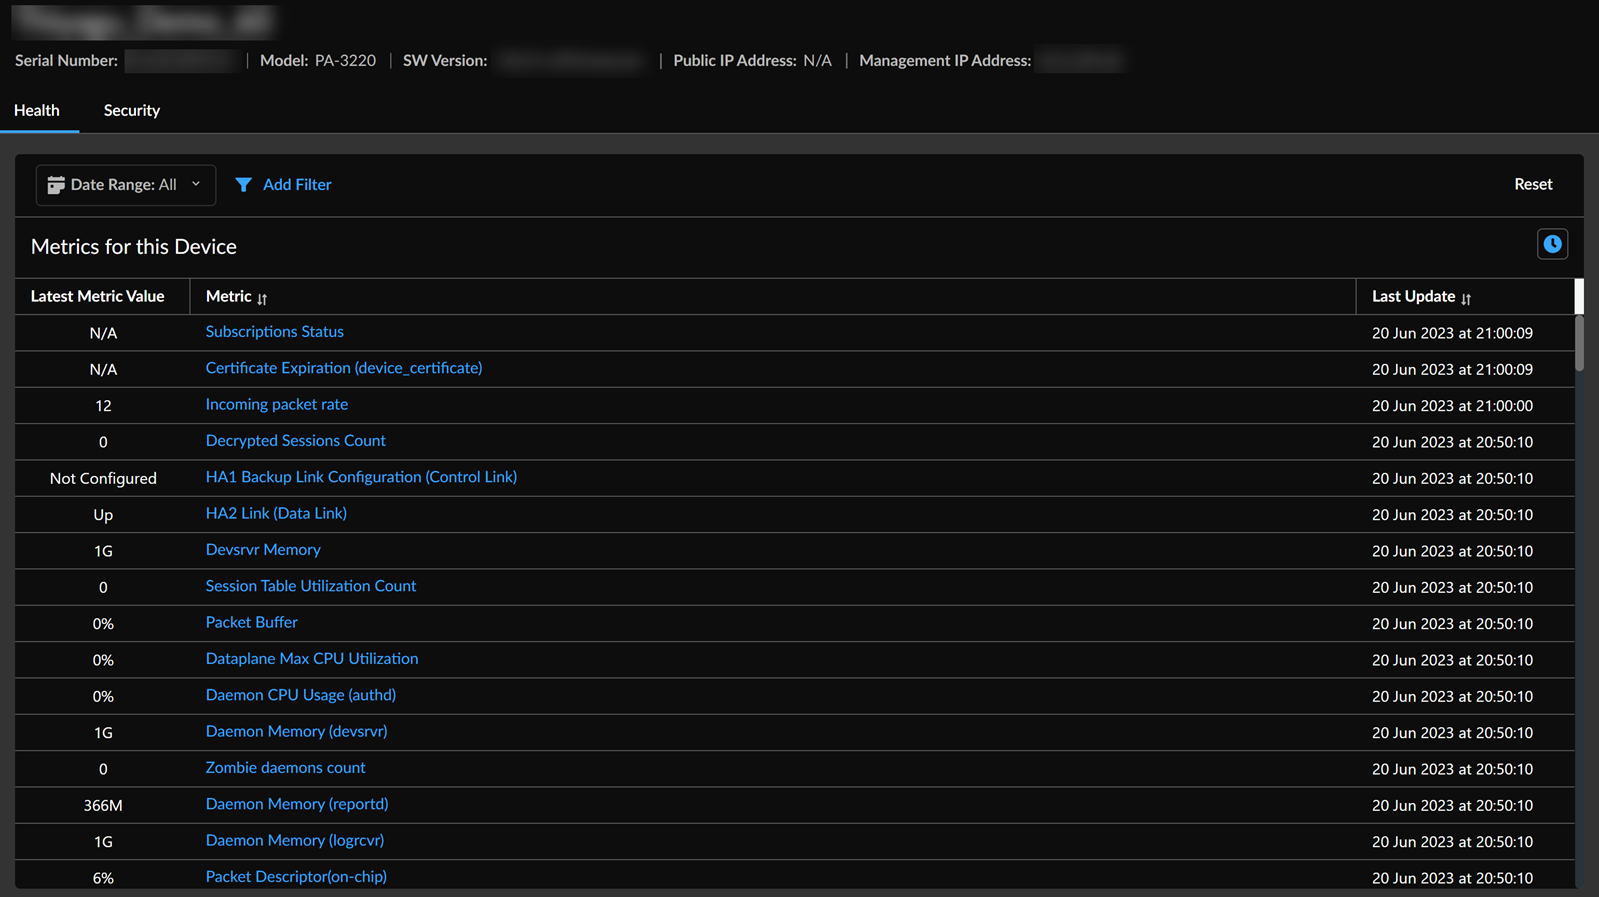
| Metrics for this Device A list of all health metrics
collected for the security checks
run against the device, including HA link data. Select
a metric to view its details. |
|
|
| |
|
| |
|
| |
|
| |
|
| |
|
|