Strata Cloud Manager
SD-WAN Dashboard: Impacted Applications
Table of Contents
SD-WAN Dashboard: Impacted Applications
| Where Can I Use This? | What Do I Need? |
|---|---|
|
→ The features and capabilities available to you in Strata Cloud Manager depend on which license(s) you are
using.
|
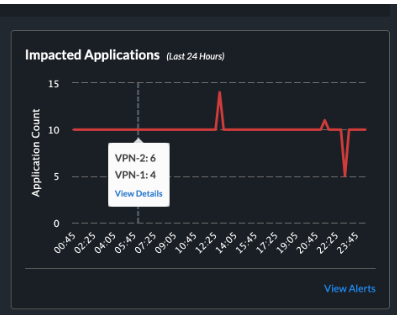
- Chart shows a trend showing impacted applications in the last 24 hours. Hover your cursor over the trend line to view impacted applications at a specific point of time.
- Click View Alerts to view the associated alerts that are raised due to the impacted applications.