View the applications which are not performing well in Prisma SD-WAN.
Where Can I Use This?
What Do I Need?
Prisma SD-WAN
Prisma SD-WAN license
WAN Clarity Reporting license to view certain widgets
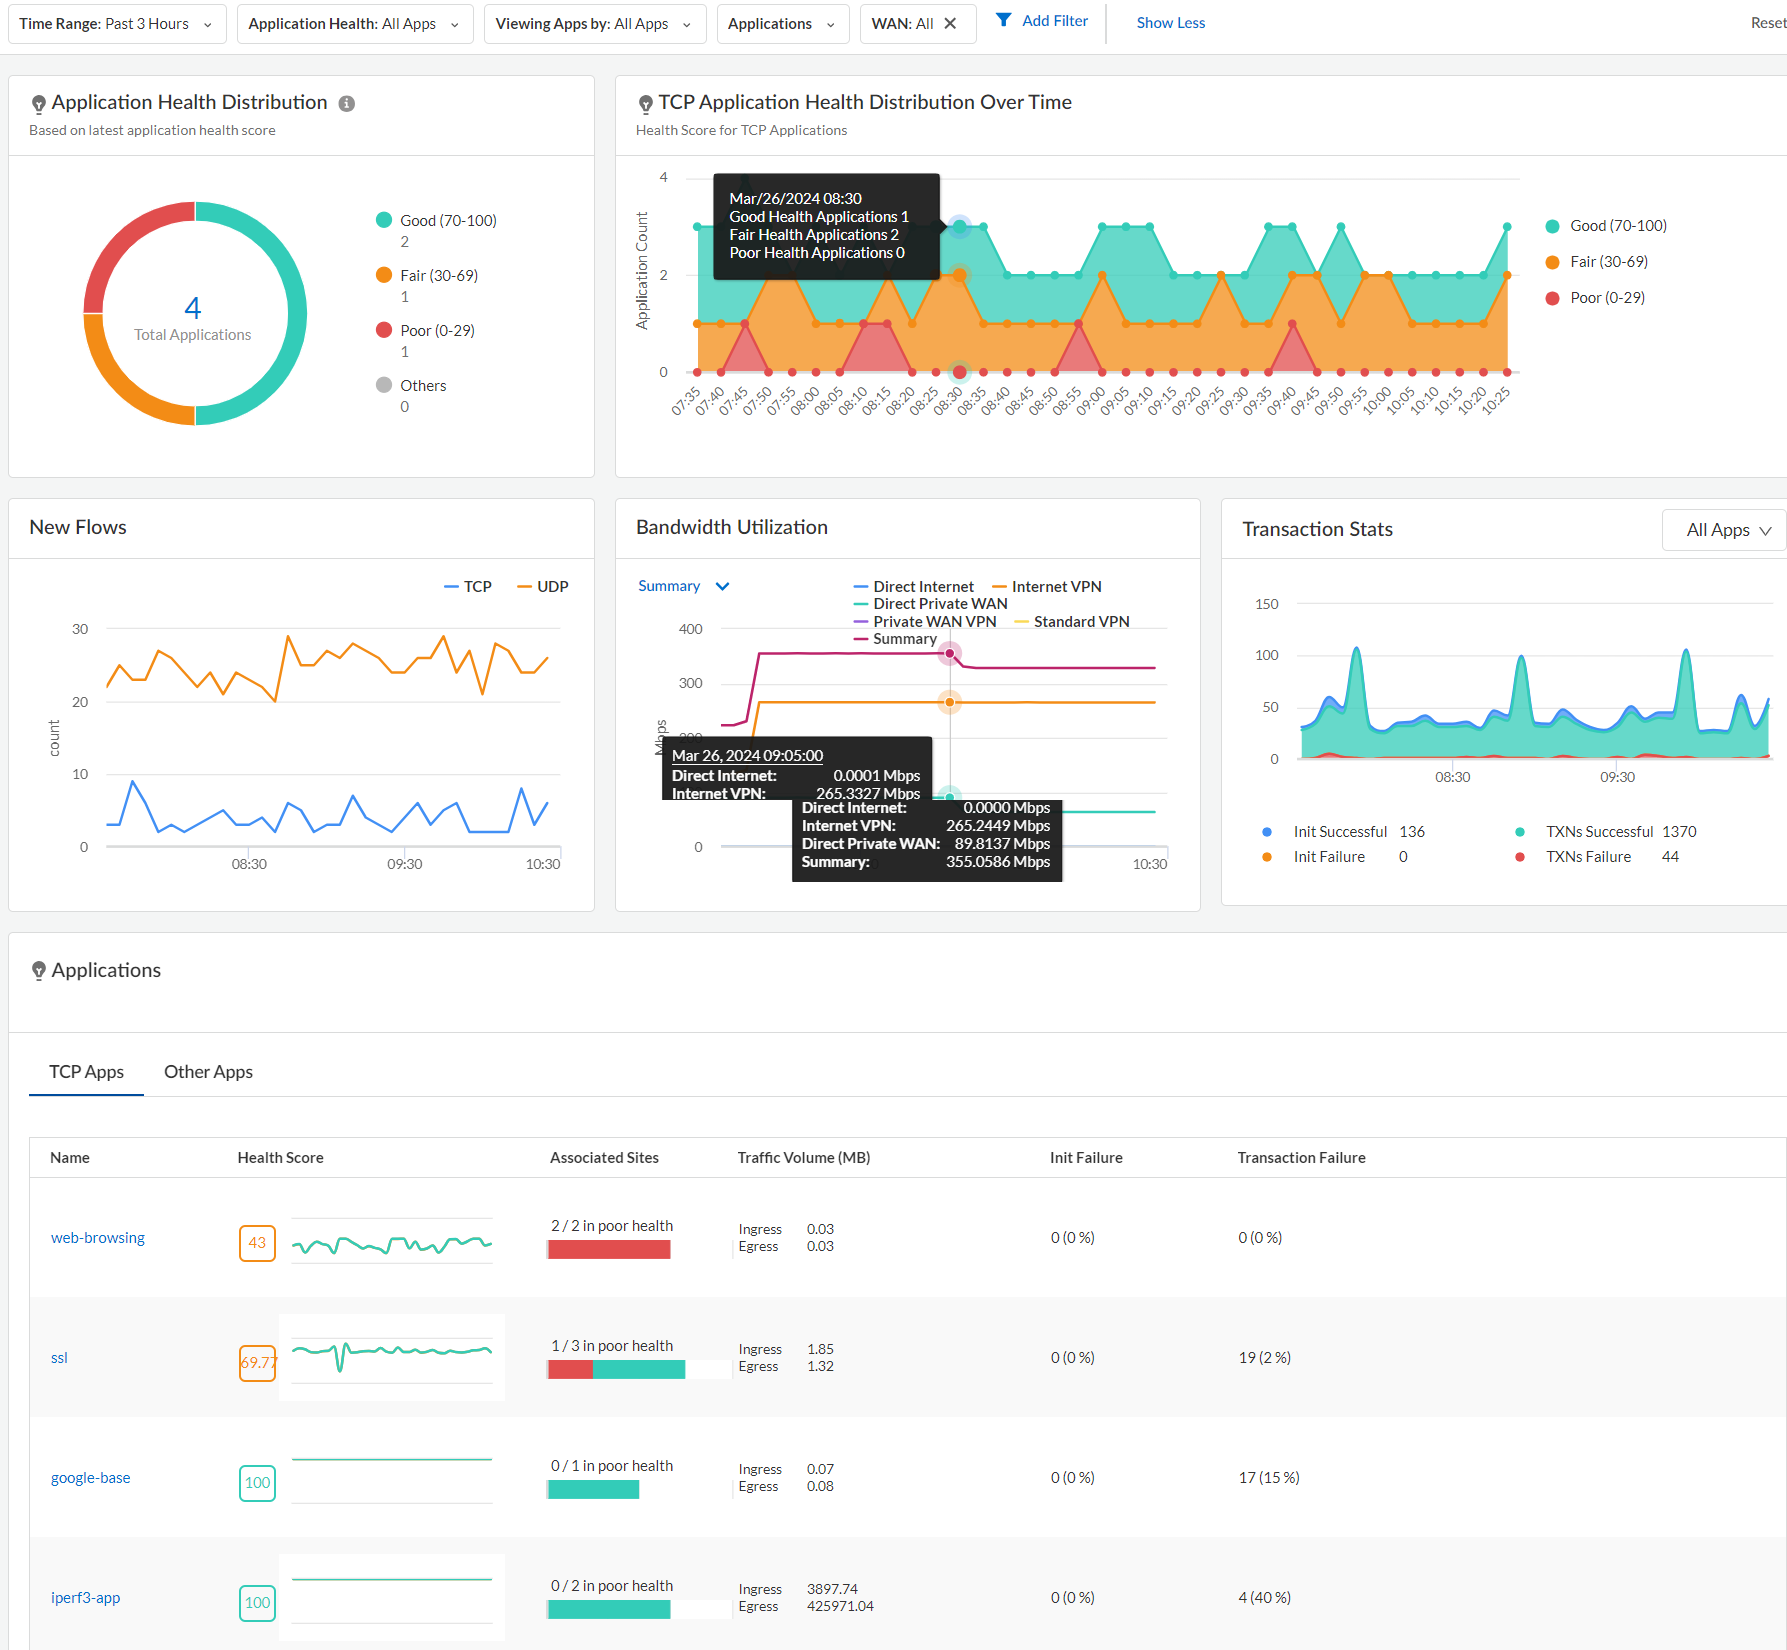
View the top applications which are not performing well in Prisma SD-WAN. See the
determined health score of all poor applications, list of poor applications for a
tenant based on health score, and the average health score of poor applications for
the last 3 hours in 5 minutes intervals.
Application Health Distribution—(requires WAN Clarity
license) The distribution of Good, Fair, and Poor applications for
a given tenant.
TCP Application Health Distribution Over Time—(requires WAN
Clarity license) The distribution of Good, Fair, and Poor TCP
applications health distribution over a period of time. The time-series
graph should be computed and refreshed based on the selected duration. For
example, supported durations are 1 hour, 3 hours, one day, seven days, 30
days, and 90 days and the interval is 1 minute, 5 minutes, 1 hour, and one
day, respectively.
New Flows—Displays the new
TCP and UDP flows for an application, a specific set of applications, or all
applications for a given period. A TCP flow is considered a new flow when it
sees the first SYN packet. A UDP flow is considered a new flow when it sees
the first UDP packet in either direction. A flow is a sequence of packets in
both directions identified by the source and destination IP, source and
destination port, and the protocol.
Bandwidth
Utilization—Displays the amount of bandwidth utilized on a trail
in a network. Use the chart to identify WAN congestion in a network that may
hinder application performance. It is a visual representation of bandwidth
spike, total bandwidth consumed by a particular site, and the application;
if the upload is in ingress or egress direction. Move your cursor in the
Bandwidth Utilization chart to get a more granular view of the bandwidth
utilization with an application or time-stamp. Typically, the apps are
listed in order of their bandwidth utilization.
Transaction Stats—Provides
transaction statistics on TCP flows, including initiation/transaction
successes and failures for a specific application or all applications, a
particular path or all paths, and all health events.
Applications—Lists all the
applications details such as Name, Application Profile, Health Score,
Impacted Sites, Traffic Volume, Init/Failure, and Transaction/ Failure. When
you click the application name, you can see the individual App Details on a
new page.