Strata Cloud Manager
SASE Health Dashboard: Current Mobile Users - Map View
Table of Contents
Expand All
|
Collapse All
Strata Cloud Manager Docs
-
- Strata Copilot
- Command Center: Strata Cloud Manager
-
- Dashboard: Build a Custom Dashboard
- Dashboard: Executive Summary
-
- WildFire Dashboard: Filters
- WildFire Dashboard: Total Samples Submitted
- WildFire Dashboard: Analysis Insights
- WildFire Dashboard: Session Trends For Samples Submitted
- WildFire Dashboard: Verdict Distribution
- WildFire Dashboard: Top Applications Delivering Malicious Samples
- WildFire Dashboard: Top Users Impacted By Malicious Samples
- WildFire Dashboard: Top Malware Regions
- WildFire Dashboard: Top Firewalls
- Dashboard: DNS Security
- Dashboard: AI Runtime Security
- Dashboard: IoT Security
- Dashboard: Prisma Access
-
- Application Experience Dashboard: Mobile User Experience Card
- Application Experience Dashboard: Remote Site Experience Card
- Application Experience Dashboard: Experience Score Trends
- Application Experience Dashboard: Experience Score Across the Network
- Application Experience Dashboard: Global Distribution of Application Experience Scores
- Application Experience Dashboard: Experience Score for Top Monitored Sites
- Application Experience Dashboard: Experience Score for Top Monitored Apps
- Application Experience Dashboard: Application Performance Metrics
- Application Experience Dashboard: Network Performance Metrics
- Dashboard: Best Practices
- Dashboard: Compliance Summary
-
- Prisma SD-WAN Dashboard: Device to Controller Connectivity
- Prisma SD-WAN Dashboard: Applications
- Prisma SD-WAN Dashboard: Top Alerts by Priority
- Prisma SD-WAN Dashboard: Overall Link Quality
- Prisma SD-WAN Dashboard: Bandwidth Utilization
- Prisma SD-WAN Dashboard: Transaction Stats
- Prisma SD-WAN Dashboard: Predictive Analytics
- Dashboard: PAN-OS CVEs
- Dashboard: CDSS Adoption
- Dashboard: Feature Adoption
- Dashboard: On Demand BPA
- Manage: IoT Policy Recommendation
- Manage: Enterprise DLP
- Manage: SaaS Security
- Manage: Prisma Access Browser
- Reports: Strata Cloud Manager
-
-
- Strata Cloud Manager Release Information
-
- New Features in February 2025
- New Features in January 2025
- New Features in December 2024
- New Features in November 2024
- New Features in October 2024
- New Features in September 2024
- New Features in August 2024
- New Features in July 2024
- New Features in June 2024
- New Features in May 2024
- New Features in April 2024
- New Features in March 2024
- New Features in February 2024
- New Features in January 2024
- New Features in November 2023
- New Features in October 2023
- New Features in September 2023
- Known Issues
- Addressed Issues
- Getting Help
SASE Health Dashboard: Current Mobile Users - Map View
View the health metrics of your Mobile users across all locations in this
dashboard.
Where Can I Use This? | What Do I Need? |
---|---|
|
→ The features and capabilities available to you in Strata Cloud Manager depend on which license(s) you are
using.
|
The Current Mobile Users tab in the SASE
Health dashboard shows you an overview of the breakdown of Mobile User
experience across all locations. The number in the circles correspond to the number of
Mobile Users who are currently connected to Prisma Access using GlobalProtect. A dot
represents a single Mobile User. A green circle or dot indicates Good user experience
score. Likewise, a red one indicates a degraded experience score. Degraded experience
scores comprise of Fair and Poor scores combined. The line chart to the right of
Current Mobile Users shows you a trend of the average
experience scores for all Mobile Users during the selected Time
Range.
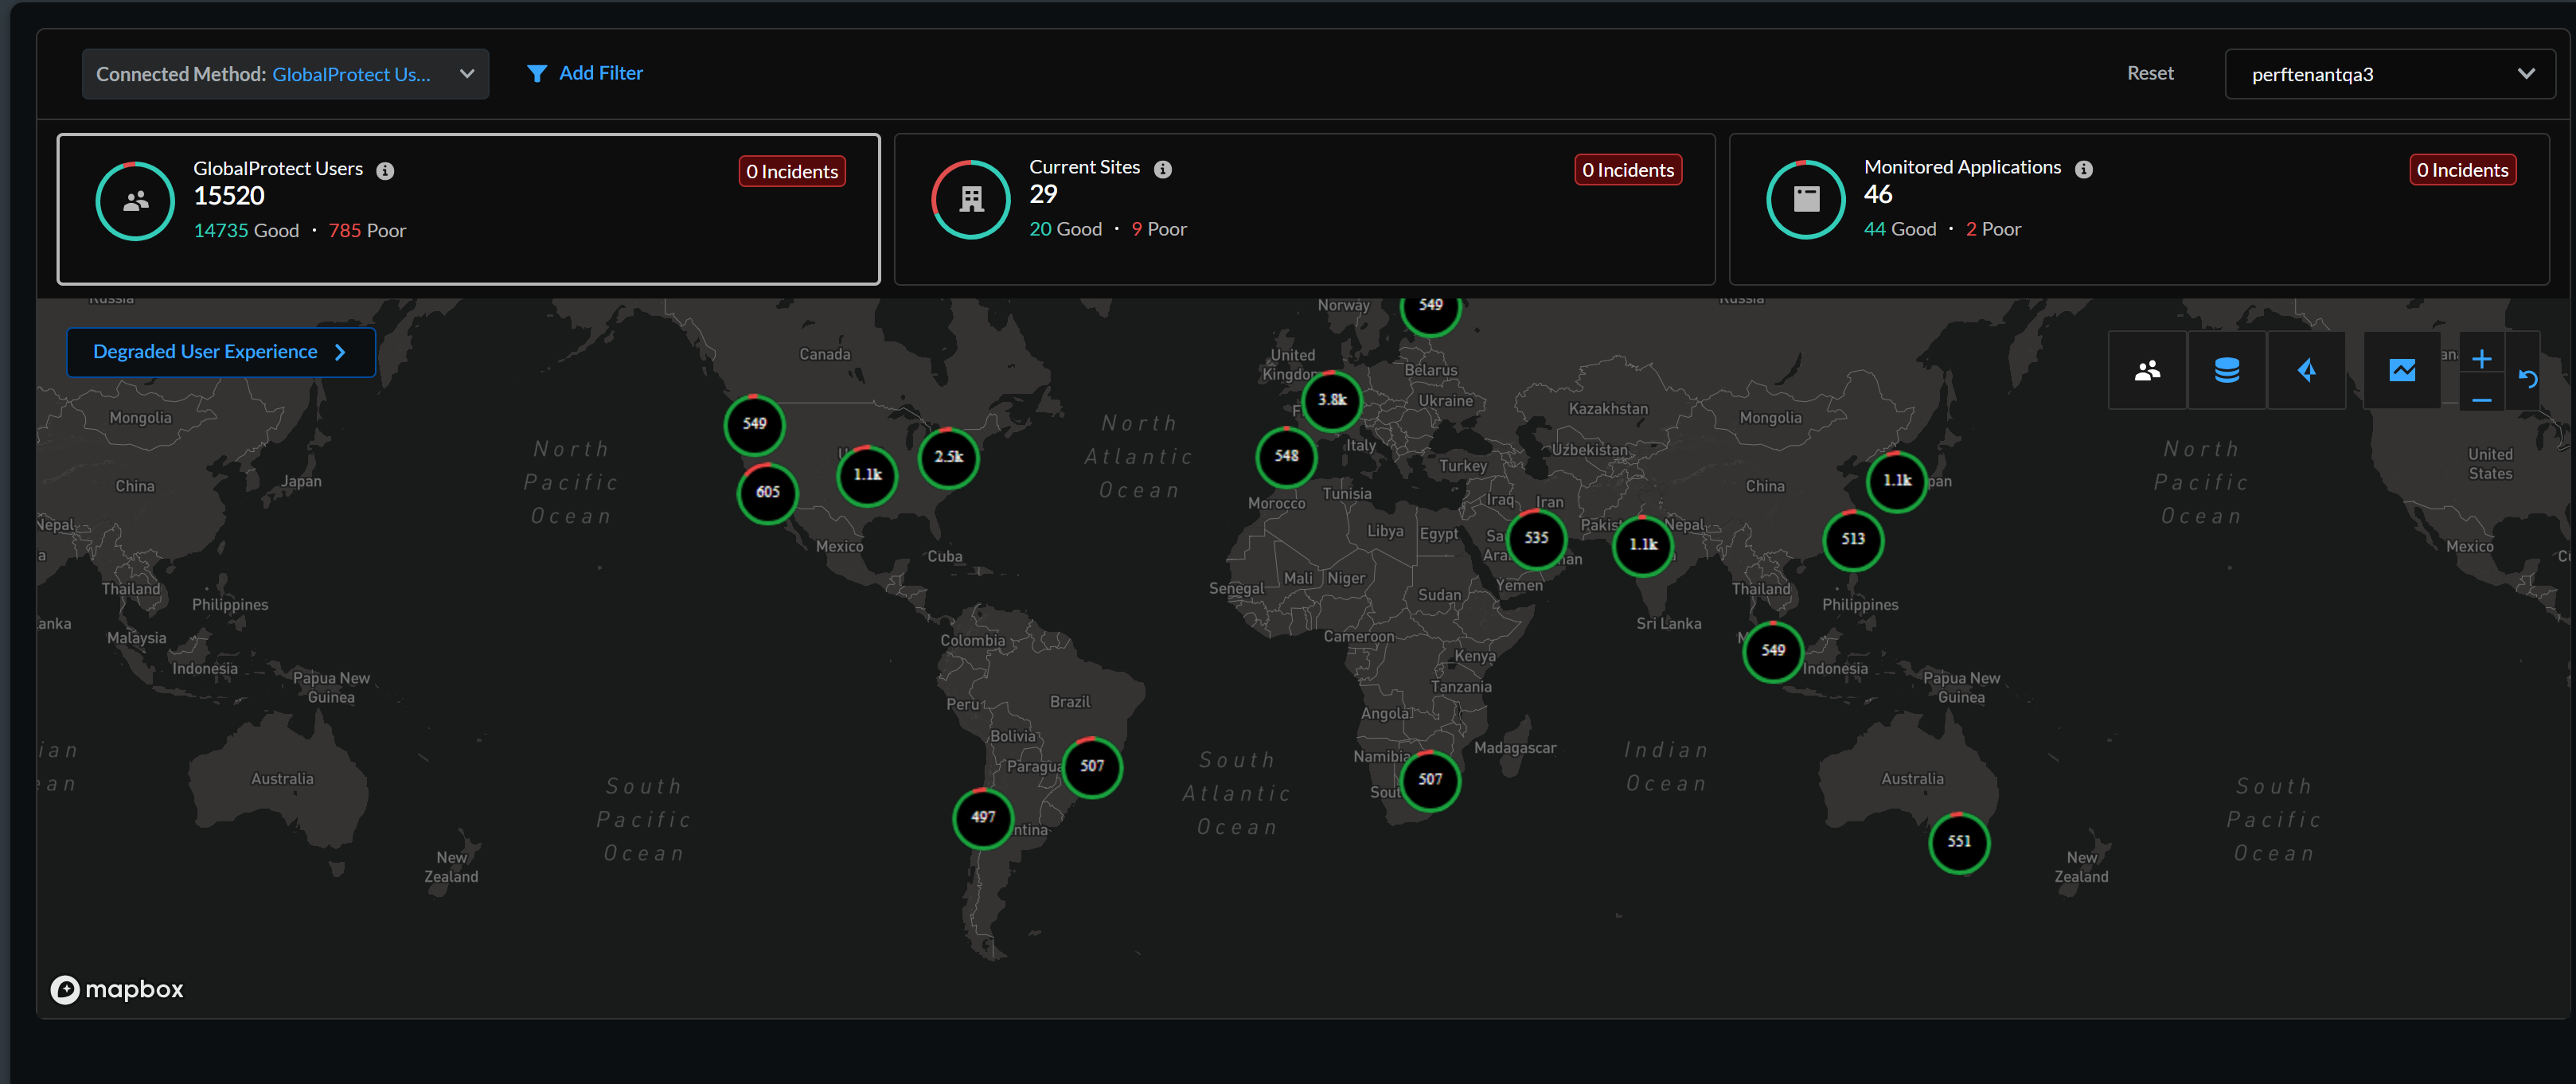
Click the number (representing the potentially degraded-experience user count) next to the
Potential Degraded Experience or
Incidents to see the details of the degraded user experience
in a pane that opens on the left.