Strata Cloud Manager
Insights: Executive Summary
Table of Contents
Insights: Executive Summary
See exactly how your Palo Alto Networks subscriptions protect you.
| Where Can I Use This? | What Do I Need? |
|---|---|
|
Each of these licenses include access to Strata Cloud Manager:
The other licenses and prerequisites needed for visibility
are:
→ The features and capabilities available to you in Strata Cloud Manager depend on which license(s) you are
using.
|
What does this dashboard show you?
The dashboard shows aggregated data per Strata Logging Service tenant.
The Executive Summary dashboard shows you how your Palo Alto Networks security
subscriptions are protecting you. This report breaks down malicious activity in
your network that these subscriptions are detecting:
WildFire, Advanced Threat
Prevention, Advanced URL Filtering, and
Enterprise DLP. The dashboard shows data for each of
these service with links to security services dashboards to dive deeper for
further investigation.
This dashboard supports reports. These icons,
![]() in the top right of a dashboard indicate that
reports are supported for this dashboard. You can share, download, and schedule
reports that cover the data this dashboard displays.
in the top right of a dashboard indicate that
reports are supported for this dashboard. You can share, download, and schedule
reports that cover the data this dashboard displays.
The dashboard provides the following data.
- Security Subscriptions Overview: This report gives you the numbers on the malicious activity your subscriptions are detecting and preventing:
- high-risk applications
- severe threats (exploits, malware, and C2)
- malicious web activity
- file-based threats (including never-before-seen threats)
- data loss
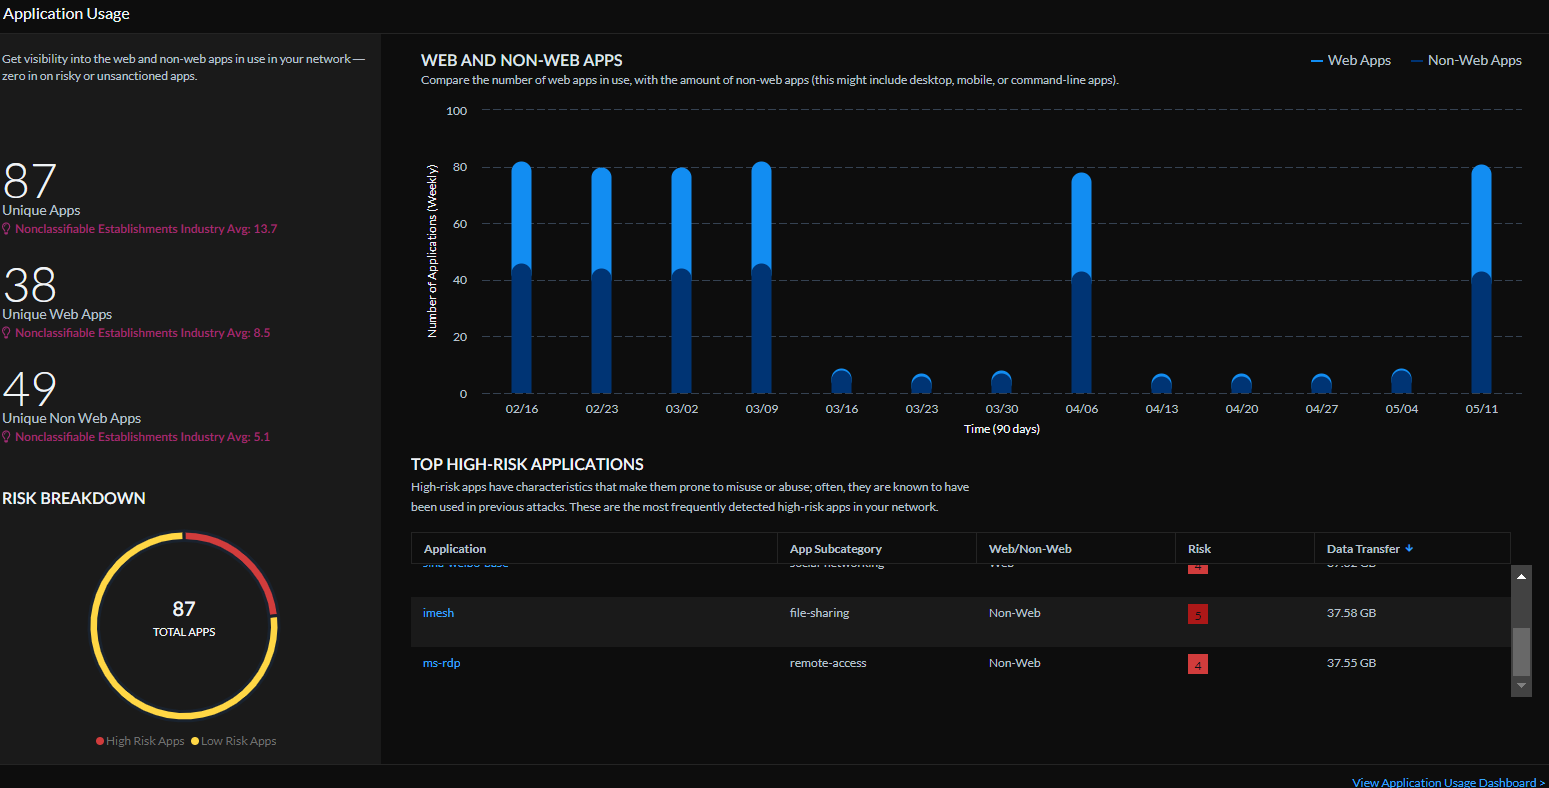
- Application Usage: Review the traffic logs for high-risk applications
and see how you can strengthen the security posture.
![]()
- Advanced Threat Prevention: Examine the security policy rules that
allow most threats. Review these rules to see where
you can enable stricter threat enforcement. Learn more.Requires Advanced Threat Prevention license.
- URL Filtering: Review the malicious web activity in your network,
particularly the number of malicious web sites that your users are
attempting to access.Requires Advanced URL Filtering license.
![]()
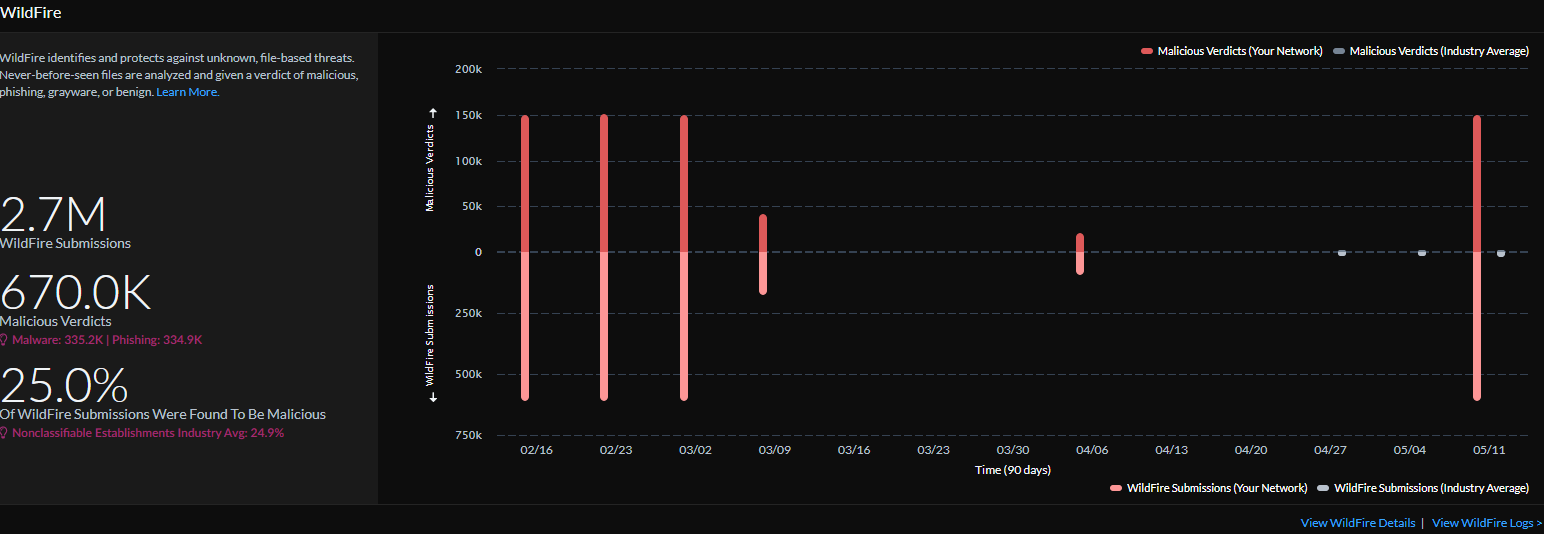
- WildFire: Learn more. ➡Requires Advanced WildFire license.
![]()
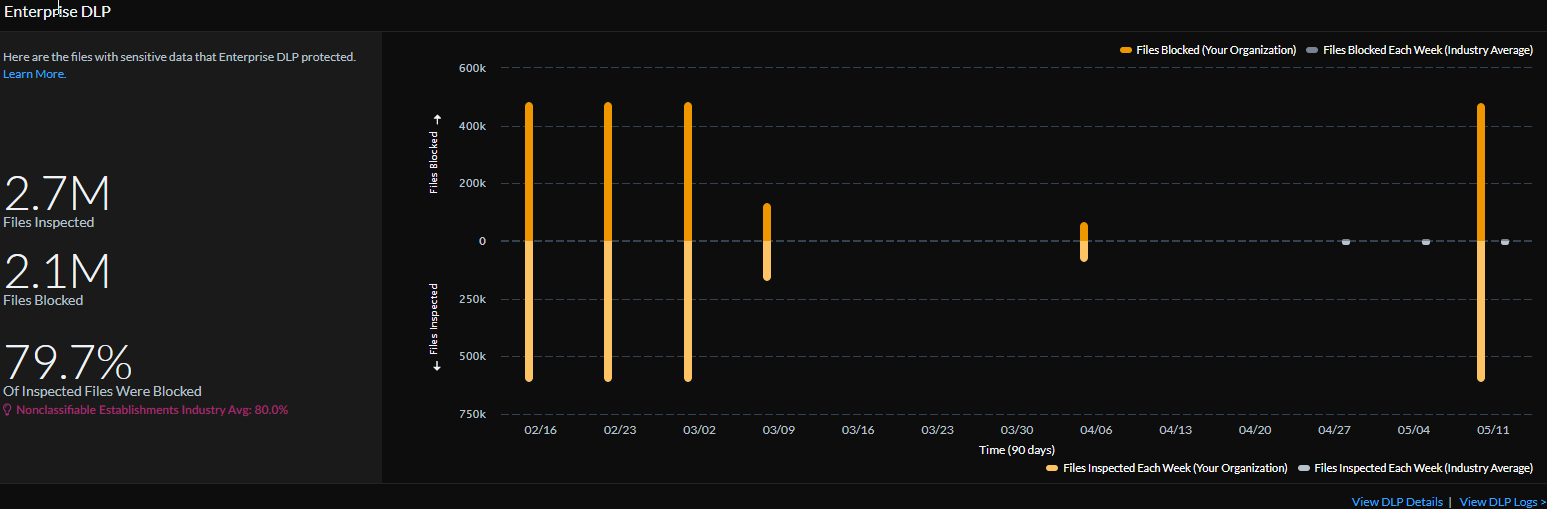
- Enterprise DLP: See how your Palo Alto Networks Enterprise DLP
service is protecting your data by enforcing data security standards. The
dashboard gives insights into the applications to which most uploads are
prevented by DLP and the total number of files that are blocked by DLP in
your network. You can also use this data to compare with your industry peers
and benchmark your security posture standards.Review the applications and source usernames to better understand where the DLP incidents originated and manage them.Requires Enterprise DLP license.
![]()

How can you use the data from dashboard?
- Review all the malicious activity that the active Palo Alto Networks subscriptions are detecting. See if you need to refine the subscription settings or security rule settings to close any security gaps.
- Shows you industry data to gives you perspective on the threat landscape you’re facing and how you stack up against your peers.