Strata Cloud Manager
Insights: Capacity Analyzer
Table of Contents
Insights: Capacity Analyzer
Learn how to analyze and monitor your devices' resource capacity.
| Where Can I Use This? | What Do I Need? |
|---|---|
|
→ The features and capabilities available to you in Strata Cloud Manager depend on which license(s) you are
using.
|
Capacity Analyzer allows you to analyze and monitor your devices' resource capacity by
keeping track of their metrics usage based on their model types. Capacity Analyzer
provides the following benefits:
- A comprehensive understanding of the existing metric utilization and the unutilized metric capacity up to the maximum limit.
- A heatmap visualization that showcases metrics usage with respect to the hardware platforms in a single view and helps drill-down into details.
- The ability to plan for upgrading to higher capacity firewalls based on your specific needs.
- The Capacity Analyzer feature is not supported for the VM Series firewalls.
- The Capacity Analyzer feature displays capacity insights and its incidents only after its AI/ML model has studied current and past usage. This process requires a minimum of 7 days of telemetry data.
Capacity Analyzer is enhanced to support alerts that help you to anticipate resource
consumption nearing its maximum capacity and trigger timely notifications. The Capacity
Analyzer alerts are generated three months in advance identifying potential capacity
bottlenecks. This helps you to plan configuration cleanup or upsize NGFW capacities
before they hit maximum usage and maintain system stability. See Premium Health Alerts for the list of
supported Capacity alerts.
Capacity Analyzer supports the following metrics:
- Configuration resource metrics:
- ARP table size
- GlobalProtect™ Clientless VPN
- IKE Peers
- VPN Tunnels
- Address Objects
- Address Groups
- FQDN Address
- Service Objects
- Service Groups
- NAT Policies
- Security Policies
- Virtual Systems (Count)
- System resource metrics:
- Dataplane (DP) CPU
- Management Plane (MP) CPU
- MP Memory
- Traffic resource metrics:
- Concurrent Decryption Sessions
- Sessions Table Utilization
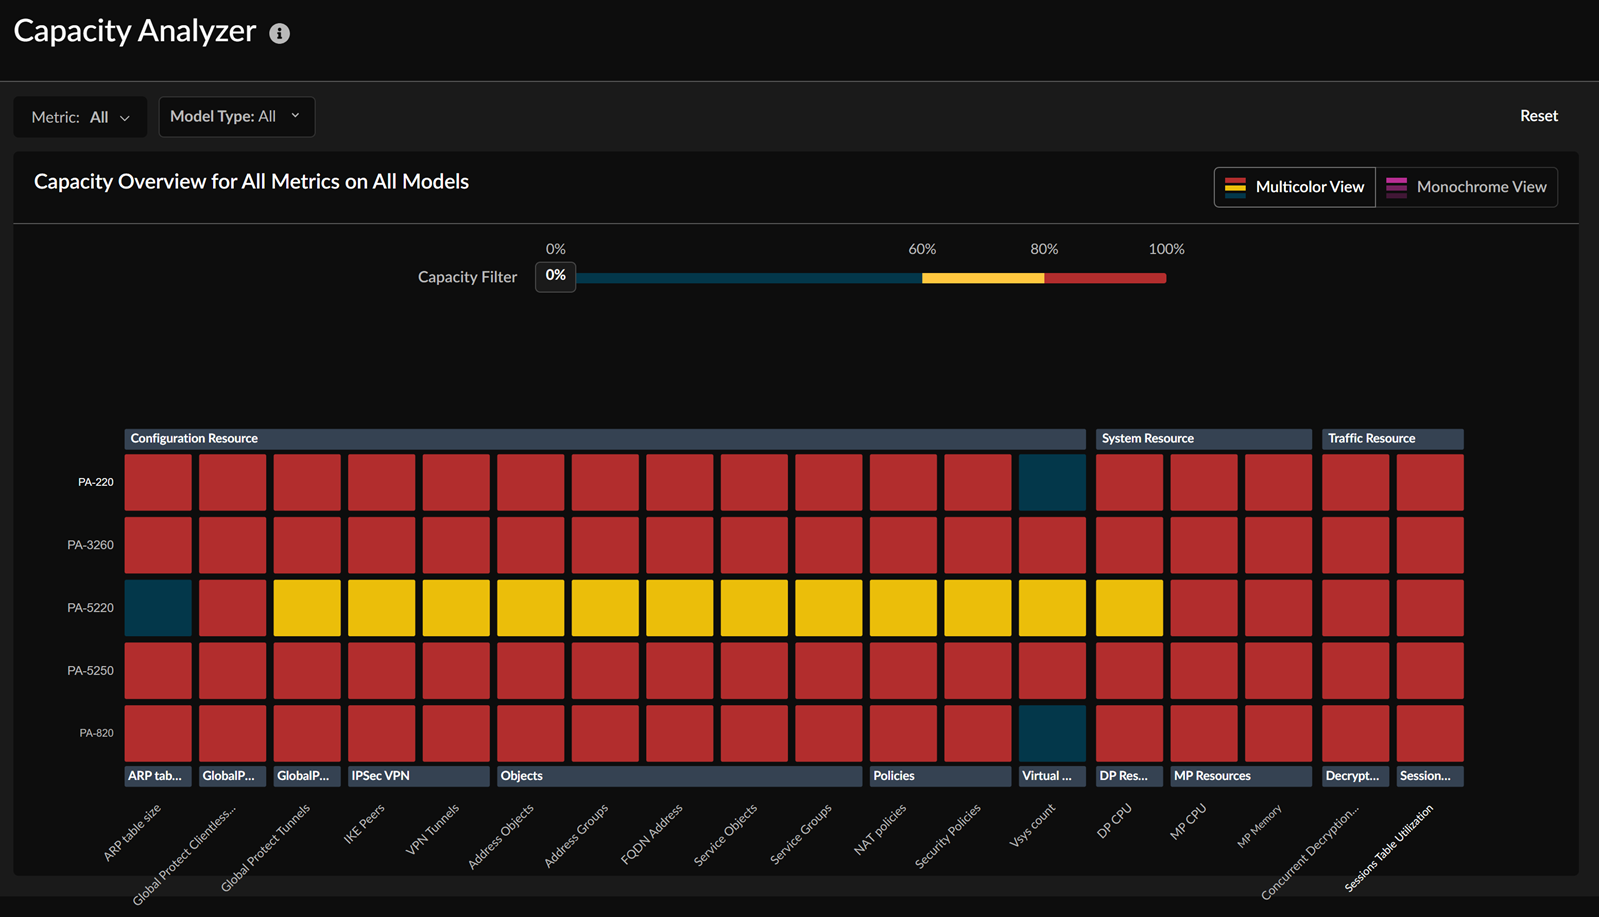
The heatmap shows metrics usage for every device. The darker color represents a higher
utilization and the lighter color indicates a lower utilization. By default, the
Multicolor View is selected. You can switch to the
Monochrome View as well.
Here are the different ways in which you can use the Capacity Analyzer heatmap to obtain
information about metric usage:
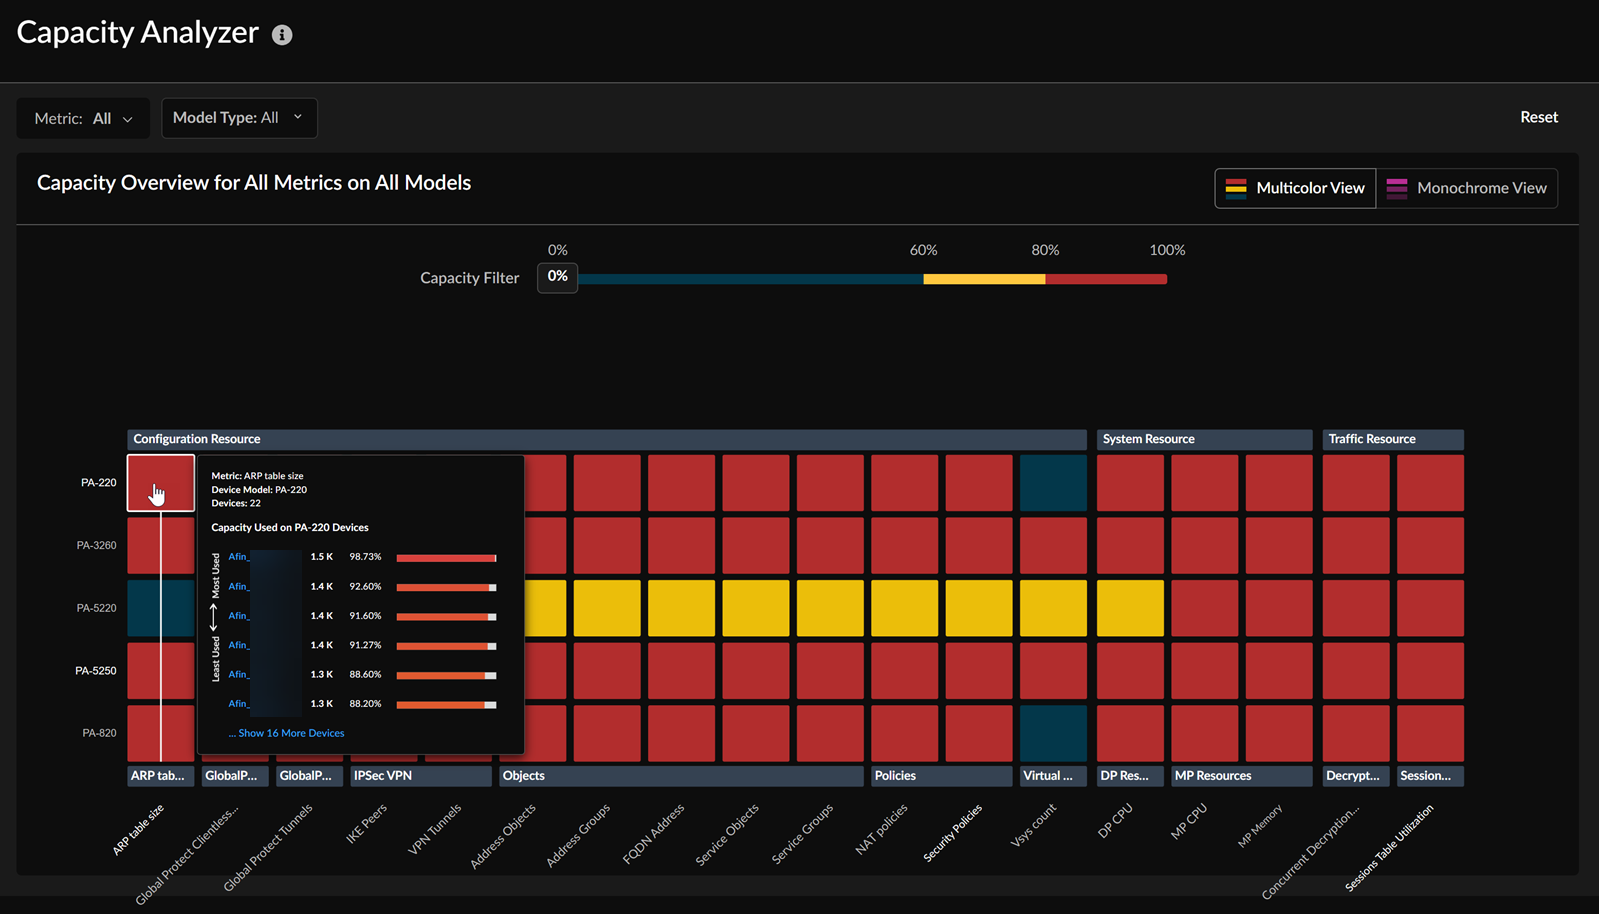
- Hover your cursor on a metric block for a device to view a tooltip that provides the following details:
- Name of the metric
- Device model and list of devices
- Device capacity range
![]()
- Filter data using the following attributes:
- Metric - Select one or more metrics that you want to view or search using the metric name.
- Model - Select one or more device models or search using the model name.
- Capacity - Select the capacity on the Capacity Filter scale.
To learn more about how to use the Capacity Analyzer heatmap, see Analyze Metric Capacity.