Strata Cloud Manager
Insights: Prisma SD-WAN Applications
Table of Contents
Insights: Prisma SD-WAN Applications
See Prisma SD-WAN application utilization experience for a period of
time.
| Where Can I Use This? | What Do I Need? |
|---|---|
|
The other licenses and prerequisites needed for visibility
are:
→ The features and capabilities available to you in Strata Cloud Manager depend on which license(s) you are
using.
|
The Applications widget displays information
about the application utilization at the site during the selected time range. The total
application ingress and egress traffic for the time range is displayed. The top 10
applications by traffic volume are displayed along with the other traffic. Click
View All to see the application health distribution, TCP
application health distribution over time, new flows, bandwidth utilization, transaction
stats for the selected time range along with the top applications. You can drill down to
view an application's performance and metrics per site for the selected time range in
the dashboard.
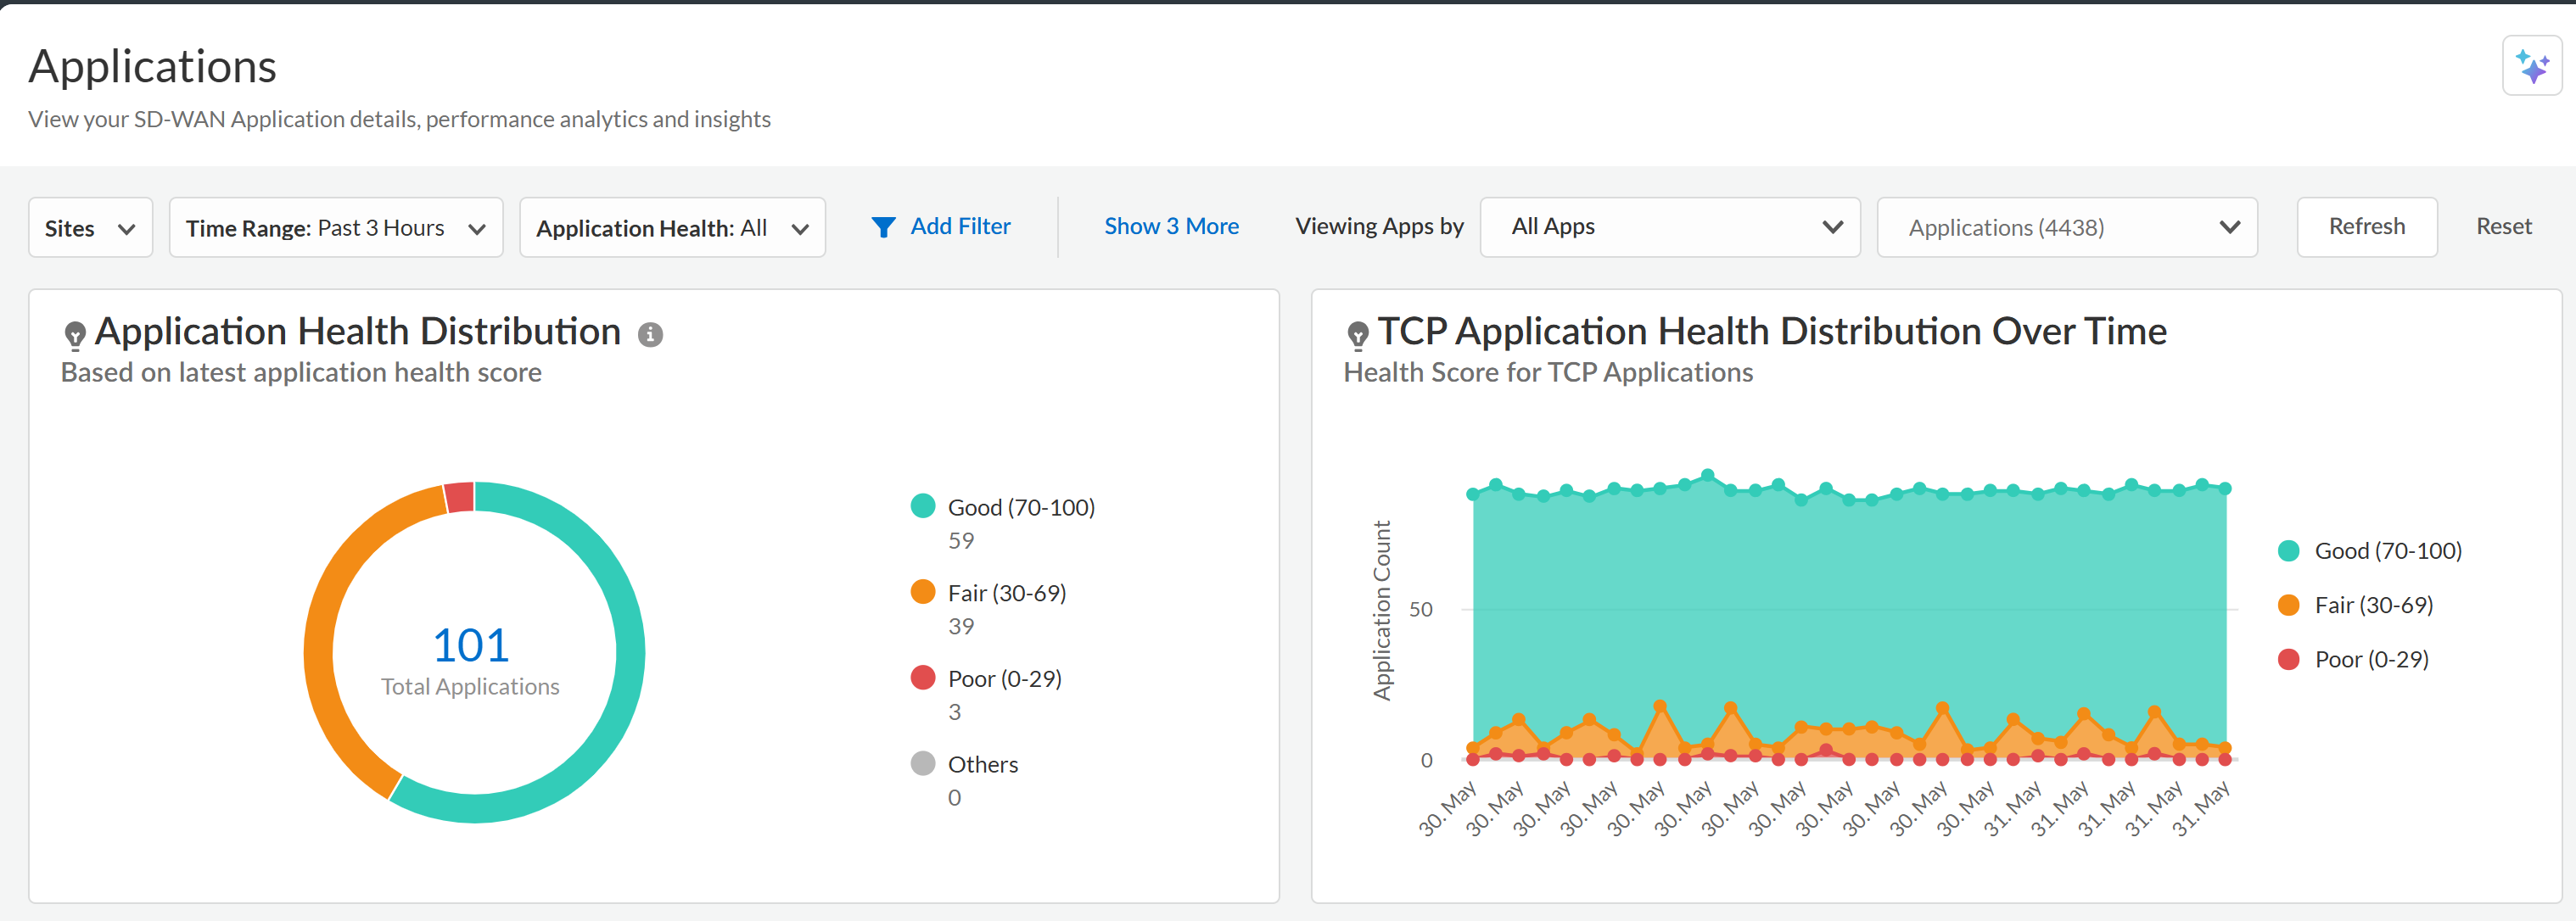
The metrics for all TCP applications are initially displayed but, any one of the top 10
TCP applications can be selected to more narrowly focus on a specific top application.