Strata Cloud Manager
Activity Insights: Overview
Table of Contents
Activity Insights: Overview
Activity Insights gives you an in-depth view of your network activities across Prisma Access, NGFW, and Prisma SD-WAN deployments.
| Where Can I Use This? | What Do I Need? |
|---|---|
|
Each of these licenses include access to Strata Cloud Manager:
The other licenses and prerequisites needed to access certain
Activity Insights views are:
→ The features and capabilities available to you in Strata Cloud Manager depend on which license(s) you are
using.
|
View the summary of most seen applications, threats, users, URLs,
and rules in your network for the selected time period. Glance through this view to
quickly identify any irregularities within your network and then delve deeper to
examine the activity that requires investigation. The Overview view includes:
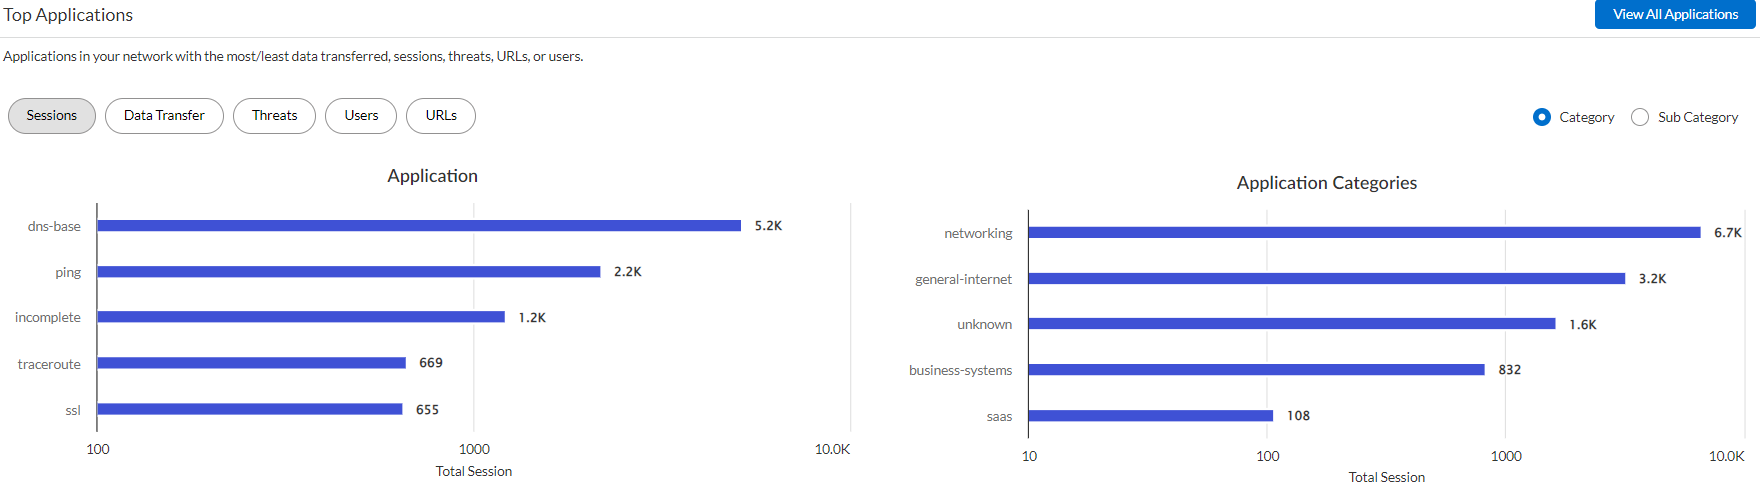
- Top 5 applications and application categories in your network that have the maximum activity in terms of number of sessions, data transfer, threats detected, URLs accessed, and users who accessed the applications. Click View all Applications to refer to the application details.
![]()
- Top 5 threats and threat categories that are most affecting the sessions, users, and applications. View the details of sessions, users, and applications in the Log Viewer, Users, and Applications tabs, respectively.
![]()
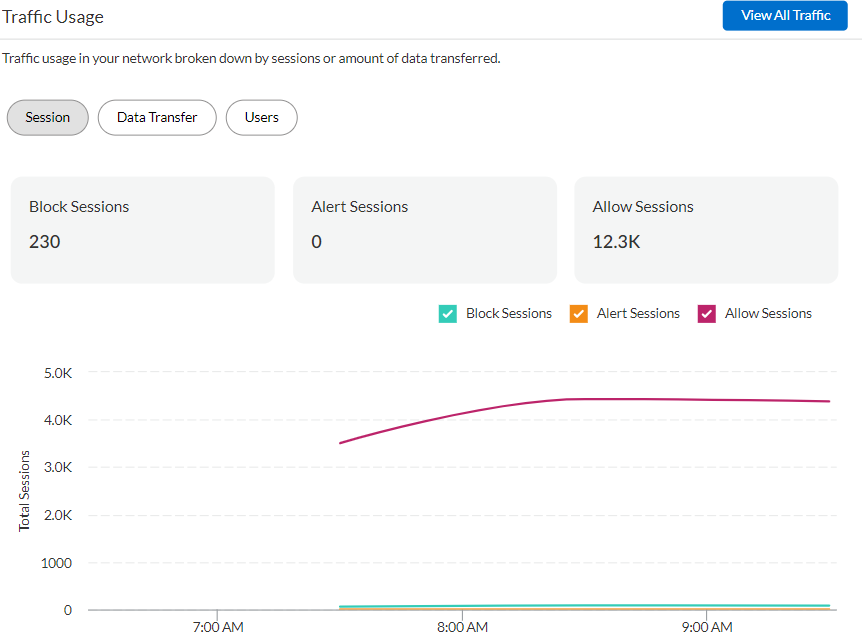
- Network traffic trend of blocked, allowed, and alerted sessions, the amount of data transferred, and users generating the most traffic.
![]()
- Top 5 users with most traffic sessions, data transferred, threats found in traffic, URLs accessed, and the user experience scores for monitored applications.
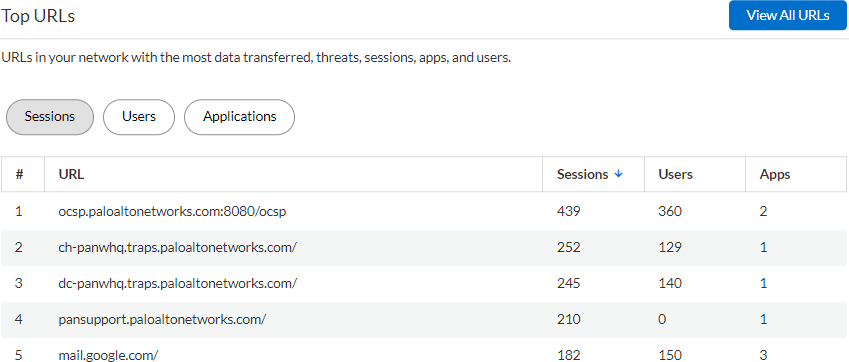
- Most accessed URLs along with details on session, users, and applications accessing the URLs.
![]()
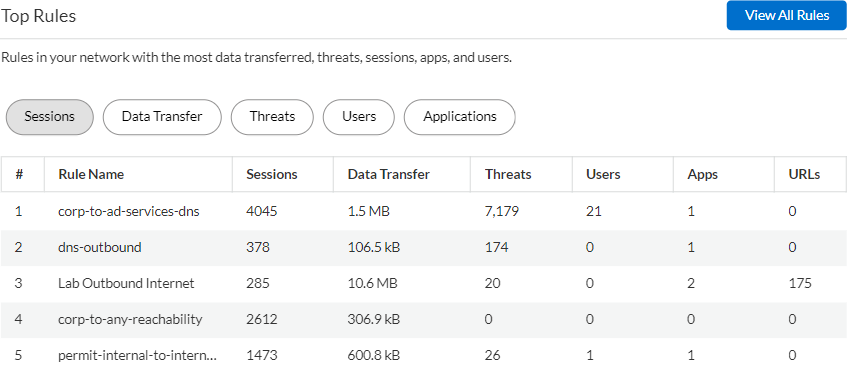
- Top 5 most impacted Security policy rules configured in your deployment with filters to know the sessions, users, URLs, threats, data transferred, applications involved in the traffic matching the rules.
![]()

You can use the filters to view the data points you want to focus on
and relevant to your deployment. These filters are available in all the tabs of the
dashboard.

Filters
Activity Insights has advanced filters to help you focus on the
security aspects that matter to your deployment. The available filters are:
- Time Range—View data for a specified time period
- Scope Selection—Data specific to a deployment: Prisma Access, NGFW, and Prisma SD-WAN.
- Subtenant—The Prisma Access instance for which the data is displayed
- User Name—View activities involving an individual user
- Application—Network events concerning a specific application
- Application Type—Type of application; SaaS, internet, private
- Threat Category—Data for a particular category of threat
- Threat Action—View specific to allowed or blocked threats
- URL Risk Level—Data concerning the URLs with specific risk level; high, medium, or low
- URL Category—Filter the data based on the URL categories
- Source Location—View activity that originated from a specific location
- Destination Location—View activity targeted to a specific region
- URL—Activity related to a specific URL accessed.
- SaaS Application—Data concerning a specific SaaS application
- Sanctioned Application—View data for sanctioned or unsanctioned applications only
- Port Type—Sort traffic from applications traversing through standard or nonstandard ports
- Protocol—See traffic that uses a specific TCP, UDP, or HTTP ports
- Source Type—View activity generated from a particular device, users, or others
Time Range Selection Filter
The Time Range selection filter appears
at the top of the dashboards where you want to filter information by time
range.
The time is localized, so you can filter based on the local time
for your region. Data is fetched every minute, but datapoints shown in most
histograms vary according to the Time Range
selected.
For your convenience, Prisma Access lets you pick the Time
Range from a few predefined ranges or configure your own
date and time range:
- Last 15 min1 datapoint for every 3 minutes for a total of 5 datapoints.
- Last 1 Hour1 datapoint for every 3 minutes for a total of 20 datapoints.
- Last 3 Hours1 datapoint for every 3 minutes for a total of 60 datapoints.
- Last 24 Hours1 datapoint for every 5 minutes for a total of 288 datapoints.
- Last 7 Days1 datapoint for every 30 minutes for a total of 336 datapoints.
- Last 30 Days1 datapoint for every 3 hours for a total of 180 datapoints.
- CustomYou can set a custom time interval (for example, date and the time example start at 5:00 pm on June 1 and end at 4:00 pm on June 2) in addition to the prepopulated Time Range selections available in the filter.To set a start time, first select the date in the calendar, then select the time under Start. Apply the start time, then set the end time by selecting an end date in the calendar and a time under End.Once you set a custom time range, it gets saved and applied across all widgets within Insights that use the time range filter to display data instead of real-time data.You can pick from prepopulated Time Range selections for custom time intervals:
- Last 15 min1 datapoint every 3 minutes for a total of 5 datapoints.
- Last 1 Hour1 datapoint every 3 minutes for a total of 20 datapoints.
- Last 3 Hours1 datapoint every 3 minutes for a total of 60 datapoints.
- Last 24 Hours1 datapoint every 5 minutes for a total of 288 datapoints.
- Last 48 Hours1 datapoint every 30 minutes for a total of 96 datapoints.
- Last 7 Days1 datapoint every 30 minutes for a total of 336 datapoints.
- Last 30 Days1 datapoint every 3 hours for a total of 240 datapoints.
- Last 15 min
Reports
Click one of the icons
![]() in the Overview tab to download,
share, and schedule reports from the data in the Overview tab or use and click one of the icons
in the Overview tab to download,
share, and schedule reports from the data in the Overview tab or use and click one of the icons
![]() against Activity Insights
- Summary report template.
against Activity Insights
- Summary report template.