Strata Cloud Manager
Operational Health
Table of Contents
Expand All
|
Collapse All
Strata Cloud Manager Docs
Operational Health
Review the data provided by the Operational Health view.
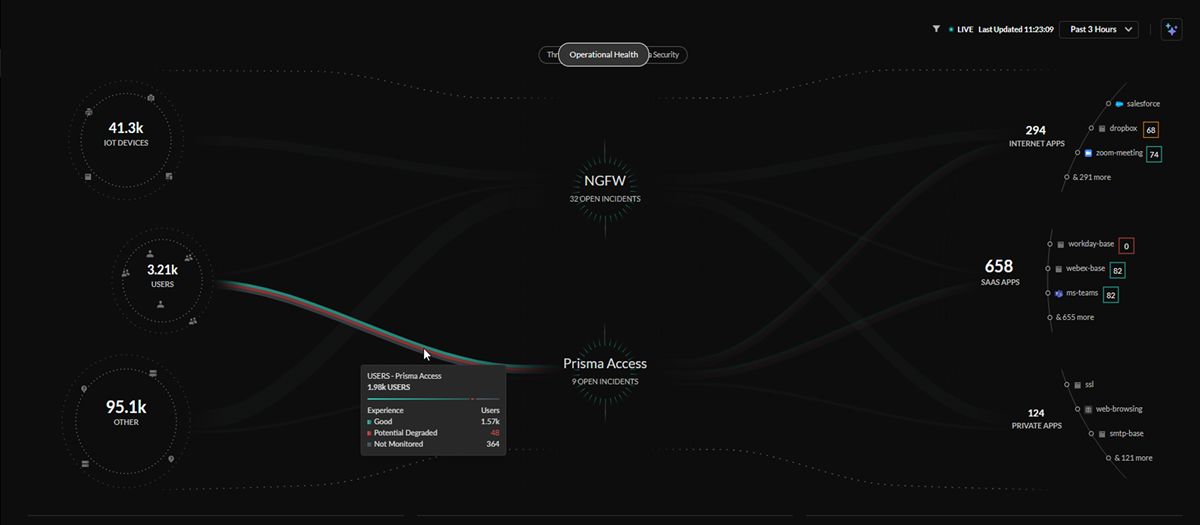
The Operational Health view shows the health of
infrastructure and user experience on your network. You can use this view to monitor
the health of your NGFWs and Prisma Access deployments as well as the user
experience on your network and review the severity of open incidents in each area.
| Operational Health Licenses |
|
Central Operational Health View
The central Operational Health view provides a look into the health of
infrastructure and of the user experience on your network. If users have an
Autonomous Digital Experience Management (ADEM) license, they will receive
enhanced data in this view.
The Operational Health view will show how your Palo Alto Networks ADEM
subscription monitors the digital experience across all users, and applications
in your SASE environment.

The lines in the central Operational Health view represent all the
users on your network. The users are organized by user experience score, with
the colors of the lines representing a rating of good, poor, or unmonitored.
Total Open Incidents and Incidents by Severity
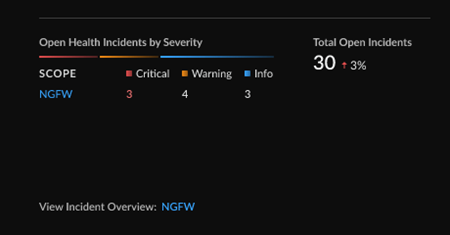
The Open Health Incidents by Severity widget
gives you a view into the all open incidents on your network, broken down by
scope (NGFW, Prisma Access, and Prisma SD-WAN), severity, and quantity of
incidents.

The widget tracks the percent change in open incidents based on the time period
selected.
Click through to the
Incidents dashboard for each available scope (IncidentsPrisma Access / NGFWAll Incidents).
Top Subcategories for Open Health Incidents
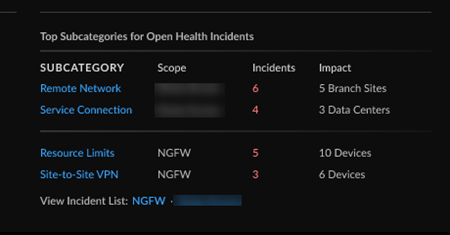
The Top Subcategories for Open Health Incidents
widget gives you a view into the top subcategories of the open health incidents
on your network, organized by scope, subcategory, quantity of incidents, and
what is impacted (data centers, sites, devices, etc.).
The widget will display the top five subcategories for a single scope, or the top
two subcategories for multiple scopes when available.

Click through to the
Incidents dashboard for each available scope (IncidentsPrisma Access / NGFW/Prisma SD-WAN).
Monitored User Devices and User Device Experience
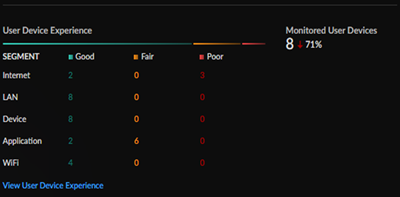
The Monitored User Devices and User Device
Experience widget gives you a view into the total count of open
incidents, the breakdown of good and potentially degraded user experience from
individual segments in the service delivery chain from a user device to an
application, and the change in open incidents from a selected time range.

Click through to the Application Experience
dashboard (InsightsOperationalApplication Experience) for a more detailed breakdown of experience across your
network and performance metrics.
