IoT Security
Security Alert Overview
Table of Contents
Expand All
|
Collapse All
IoT Security Docs
-
-
- Firewall Deployment Options for IoT Security
- Use a Tap Interface for DHCP Visibility
- Use a Virtual Wire Interface for DHCP Visibility
- Use SNMP Network Discovery to Learn about Devices from Switches
- Use Network Discovery Polling to Discover Devices
- Use ERSPAN to Send Mirrored Traffic through GRE Tunnels
- Use DHCP Server Logs to Increase Device Visibility
- Control Allowed Traffic for Onboarding Devices
- Support Isolated Network Segments
-
Security Alert Overview
IoT Security uses multiple mechanisms for detecting security
alerts.
| Where Can I Use This? | What Do I Need? |
|---|---|
|
|
All security alerts that IoT Security
generates are based on one of these mechanisms:
- Machine-learning algorithms that automatically learn normal device behavior and can, therefore, detect abnormal behavior.
- Detection of specific traffic patterns—without the use of machine-learning algorithms. For example, IoT Security generates alerts if devices connect to websites that site-reputation services have associated with malware.
- User-defined Security alert rules specifying activity or a state that generates one or more configured actions—a Security alert, user notification, device quarantine. A few examples would be when a specific activity is observed, or when it’s not observed, or when a device or group of devices goes offline for two hours. (This period of time isn't configurable.)
- Threats on an IoT device detected by a Palo Alto Networks next-generation firewall are reported to IoT Security in the threat log.
IoT Security examines network traffic in real time, analyzing communications from and to every
device on the network. It generates alerts if it detects irregular behavior or activity
matching a policy rule.
IoT Security generates alerts for IoT devices only. It
does not provide alerts, vulnerability detection, policy recommendations,
and network behavior analysis for IT devices. For IT devices, IoT Security provides device identification only.
The Alerts and Alert Details pages in the IoT Security portal
provide an overview of all generated alerts and detailed information
about individual alerts for analysis and follow-up. IoT Security
retains security alerts up to a maximum of one year.
Security alerts pertain to device settings and network behavior that indicate possible
security breaches:
- Unsecure device settings (example: devices using the default username and password)
- Suspicious behavior (example: excessive DNS lookup failures)
- Reconnaissance or exploits (examples: port sweeps and EternalBlue SMB exploit attempts)
The Security Alerts section (AlertsSecurity Alerts) consists of three pages:
- Alert Overview – This is a dashboard where you can see alerts that are most relevant to you, analyze risk on IoT devices and on your network, and observe and report alert trends.
- All Alerts – This page displays a table of alerts serially with customizable pagination, columns, and column order. You can filter the information in the table through a dialog box accessed by clicking the Filter icon ().

- Suppression Rules – This page is a list of user-defined rules created to suppress the future detection of alerts. For information, see Act on Security Alerts.
Alert Overview
The Alert Overview page is a dashboard with four main sections designed to help you
identify top priority alerts, analyze risk, and easily report on alert trends for
IoT devices.

At the top of the page is an alert summary with information about the alerts matching
the filters set for sites, device category, and time range.
- Active Alerts to Date – The is the total number of open alerts. An alert can be in one of four states: Detected, Investigating, Remediating, and Resolved. Any alert in one of the first three states—that is, any state except Resolved—is considered open, or active, and is included in this count.IoT Security retains security alerts in its database up to one year. If you've been using IoT Security longer than that, keep in mind that this count will not include any alerts discovered more than a year ago.
- New Alerts in <time range> – This is the total of all open alerts that were detected within the time range specified in the data filter at the top of the page.
- Alerts resolved in <time range> – This is the total of all alerts that were resolved within the time range specified in the data filter at the top of the page.
- Active Alerts Assigned to Me in <time range> – This is the total of open alerts that were assigned to the person currently logged in during the time range specified in the data filter at the top of the page.
Alerts of Interest – Define criteria for alerts that matter
most to you. IoT Security will then display the top ten alerts in response to your
query with the more severe and newer alerts displayed first. For example, if you
want to see alerts for a specific vendor or profile that were detected within the
last week, click the gear icon (
 ) and configure a query to show the alerts that
interest you. IoT Security then displays the ten most recent and most severe alerts
that match your terms.
By default, IoT Security uses the predefined "Major Alerts" query to search for
critical and high severity alerts detected in the past week for all IoT devices. You
can edit this query to define other attributes of interest and then click the
bookmark icon (
 ) to save it for reuse.
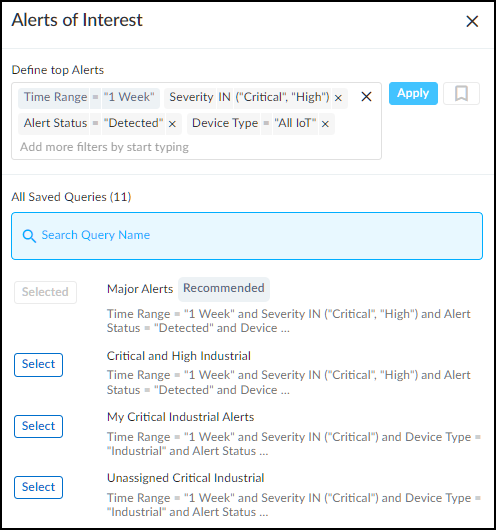
You can also toggle on Assigned to me so that IoT Security
displays only alerts within the top ten that were assigned to you. If there are more
than ten alerts, View All <number>
Alerts to see the all the alerts that matched your
criteria. IoT Security displays these on the All Alerts page. Click an alert name to
open the Alert Details page for it.
Alert Distribution – The Sankey chart lets you see the
distribution of active alerts across different groupings of devices. Reading the
chart from left to right, you start off on the left with all the active alerts that
match the site, device category, and time range filters at the top of the page. The
chart then relates these alerts to a type of device grouping in the middle and
relates these again to another type of grouping on the right. The choices for these
groupings are Severity, Profile,
Device Category, Vendor,
Status, Device Type, and
Alert Type. Alerts are distributed vertically in the
chart by count with those groupings with the most alerts at the top of the chart.
When there are more than five groupings, the Sankey chart shows the top five and
then gathers everything else in an "Others" group. Hover your cursor over
Others to see a list of the next ten groupings, and click
View all to see a pop-up panel with a complete list.
For example, to see the ratio of critical, high, medium, and low alerts among
different device categories, choose Severity for the middle
post and Device Category for the right post. The colored
bands between the left and middle posts show how many active alerts are critical,
high, medium, and low, and the colored bands between the middle and right posts show
how many alerts at each severity level were triggered by devices in different device
categories. Each band is labeled and shows the total number of active alerts for its
severity (on the left) and for that severity per device category (on the right). The
width of the bands lets you see at a glance the relative quantities of alerts by
their severity. Hovering your cursor over a section of a post shows the percent of
alerts for the adjacent bands.
Colors only convey meaning to denote alert severity levels: red = critical,
orange = high, yellow = medium, and blue = low. For other types of groupings,
semi-transparent shades of gray are used solely to distinguish one band from
another.
To download the data from the Sankey chart for your records or reports, click the
download icon (
 ) in the upper right above the chart. IoT Security
saves it as an .xlsx file with alert distribution information on the first sheet and
a complete list of active alerts on the second.
Alert Trend – The Alert Trend chart displays a cumulative
count of active alerts over the specified time period and a daily noncumulative
count of resolved alerts. This visually shows alert trends to help SOC and
management teams see if the number of active alerts has been increasing or
decreasing over time. It also displays data for resolved alerts, which can help
teams gauge their progress in regard to alert resolution. Hover your cursor over
different points on the chart to see the number of critical, high, medium, low, and
resolved alerts for different dates.
To download data from the Alert Trend chart for reports or records, click the download
icon (
 ) in the upper right above the chart. IoT Security saves it as an .xlsx file with
the active number of alerts to date and resolved alerts over the specified period of
time.
All Alerts
The All Alerts page shows all alerts, or alert instances, organized by date up to the
previous day, which is the last day for which IoT Security has a complete list of
alerts. Define filters at the top of the page to control which alerts to display.
There are filters for sites, device category, time range, and response status
(active alerts, resolved, assigned, unassigned, detected, and all). You can add more
filters as well.
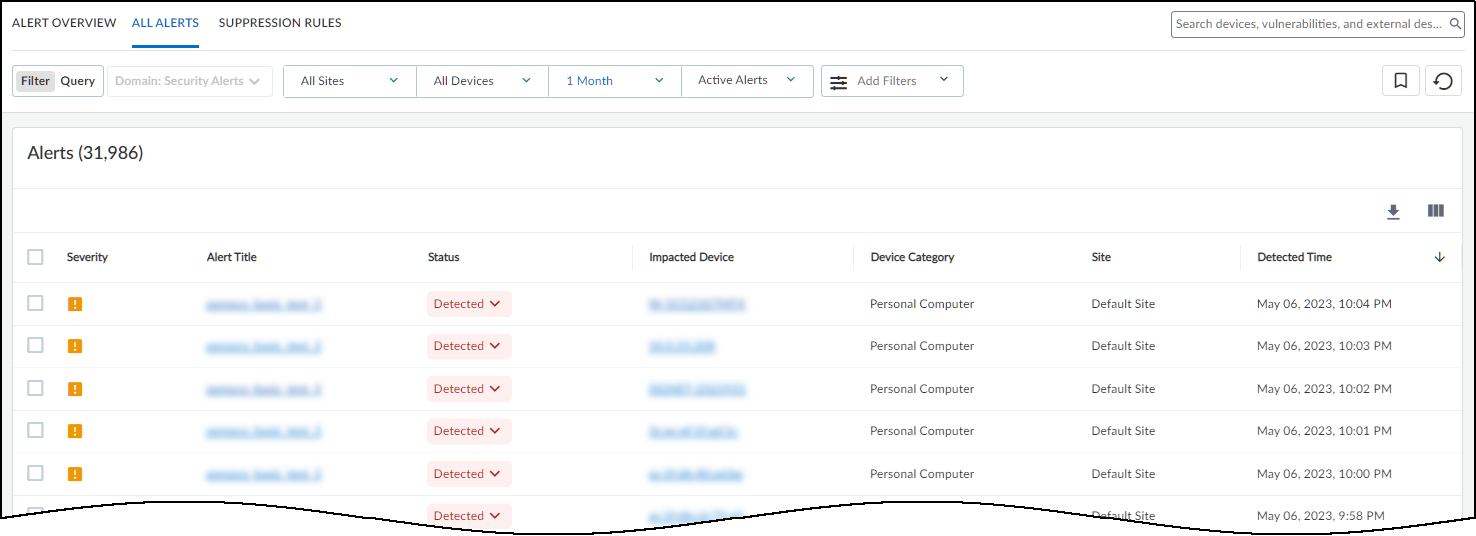
The
status of an alert begins in the Detected state. You can leave it
there or set it to a different state to reflect where it is in the
remediation process:
- Detected: This is the state of a newly detected alert instance. It makes sense to keep it in this state if no action has been taken to investigate, remediate, or resolve it.
- Investigating: Consider setting an alert instance in this state after preliminary work on it has started and it’s being verified, researched, and its impact analyzed.
- Remediating: Consider setting an alert instance in this state while action is being taken to remediate it but has not yet completed.
- Resolved: An alert instance becomes resolved either by mitigating the issue or by ignoring and accepting it.
To
change the state of an alert instance, click the entry in the Status
column and choose another state. When you resolve it, IoT Security
prompts you to provide a reason for its resolution.
To assign
an alert instance to someone to work on, select the check box for
the instance, and then click MoreAssign. Enter the username
or email address of a user and then click Assign.
The user then receives an email message that states that an alert
was assigned to him or her and provides a link to it in the IoT Security portal for investigation.
The person to whom
you assign an alert instance must have an IoT Security user account
so that it can send a message to the appropriate email address.
IoT Security provides an option for copying the details of an alert instance and creating a
work order for use with an asset management system. Select the check box for an
instance, and then click MoreCopy Alert Information. Select the sections of the alert description that you want to
include in the work order, add additional instructions or relevant information in
the Information field, and then click Copy to copy the text
in those sections.
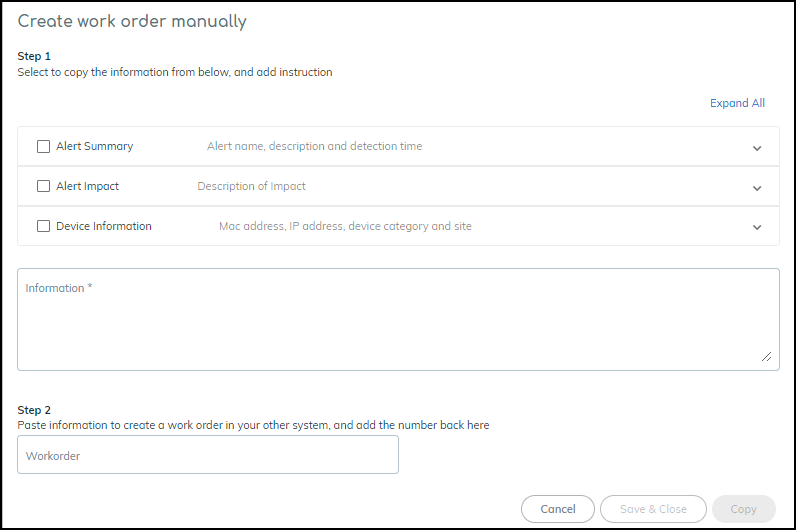
Paste the
copied content into the description field in your asset management
console as you manually create a work order there. You can then
copy the work order number from the asset management console, paste
it back in the Work order field in the Create work order manually
dialog box in IoT Security, and then click Save & Close.
To
add a note about an alert instance or the work being done on it,
select the check box for the instance, and then click MoreAdd notes.
Enter the note and then click Add.
To
see previously added notes and any previous status changes that
were made to an alert instance, click or hover your cursor over
the entry in the Last Action column for it. An historical record
about the response to the instance appears in a pop-up window.
You
can set the number of rows you want to see on each page (from 5
to 200) and navigate among multiple pages.
Security Alert Details Page
Clicking the
name of a security alert instance opens the Device Details page.
The
Alert Details page is organized into three major sections. At the
top is information about the incident itself. The client is always
shown on the left, the server on the right, and a rightward pointing
arrow between the two—solid if they formed a connection, dashed
if a connection was only attempted. The protocol or protocols used
in the connection—or attempted connection—are listed below the arrow.
The device on which the alert was raised is shown inside a box color
coded to match the severity of the alert. In this way, you can easily
see device roles and where the alert occurred.
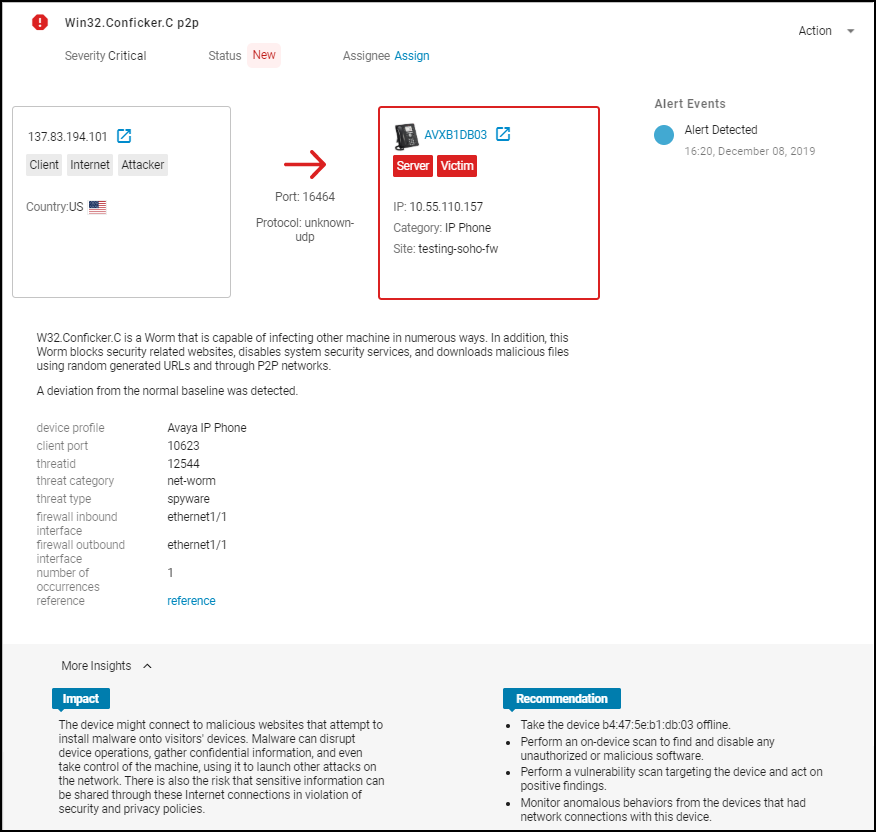
The client
on the left formed a UDP connection with the Avaya IP phone in the
server role on the right. The IP phone is the device that raised
the alert.
The blue icon next to a device name (arrow pointing
out of box) opens a new browser tab showing the Dynamic Topology
Viewer with that device in focus (see IoT Security Device Details Page). There
you can see how many other devices it communicates with and what
they are. This can be extremely useful when investigating a compromised device
because it can reveal the location of remote devices participating
in the attack and local devices that might be targets of further
attacks launched from the victim.
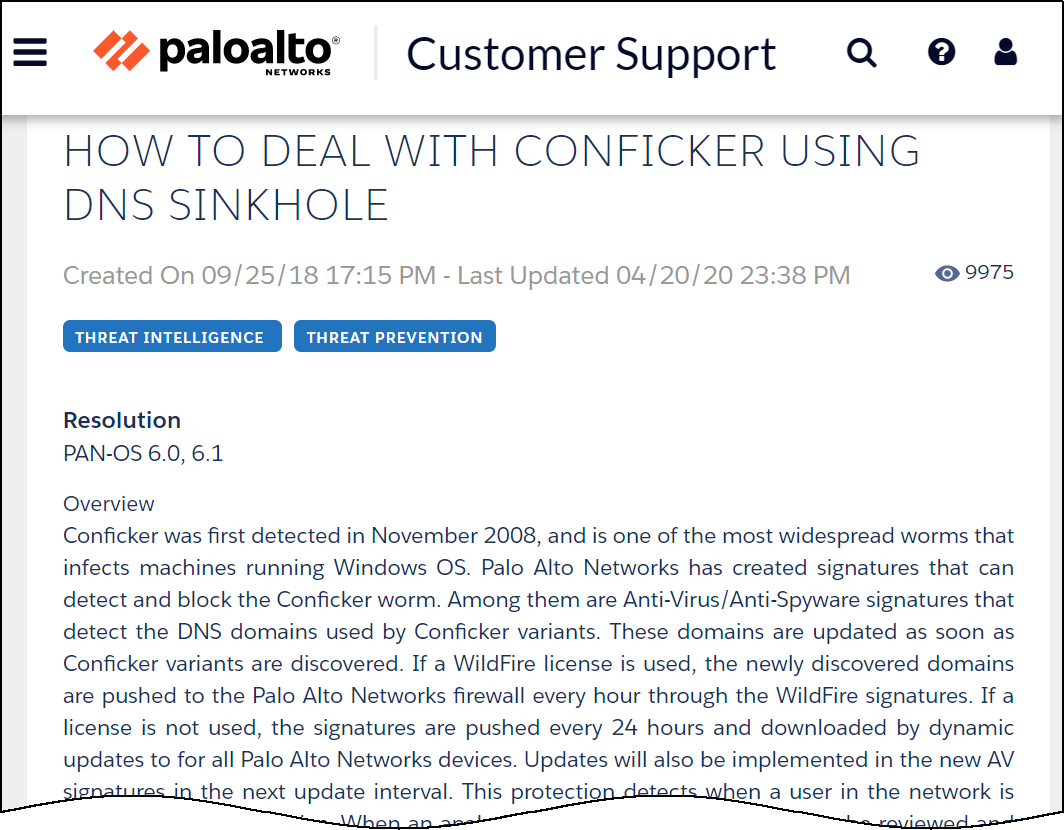
The reference links to a
Palo Alto Networks knowledge base article about the Conficker worm.
The Impact section explains
how the issue might impact the security of a user, device, or network.
(Not all alerts have an Impact section.) The Recommendation section
lists options for addressing the issue.
The second major section
on the Alert Details page examines the impacted device and summarizes
its security status.
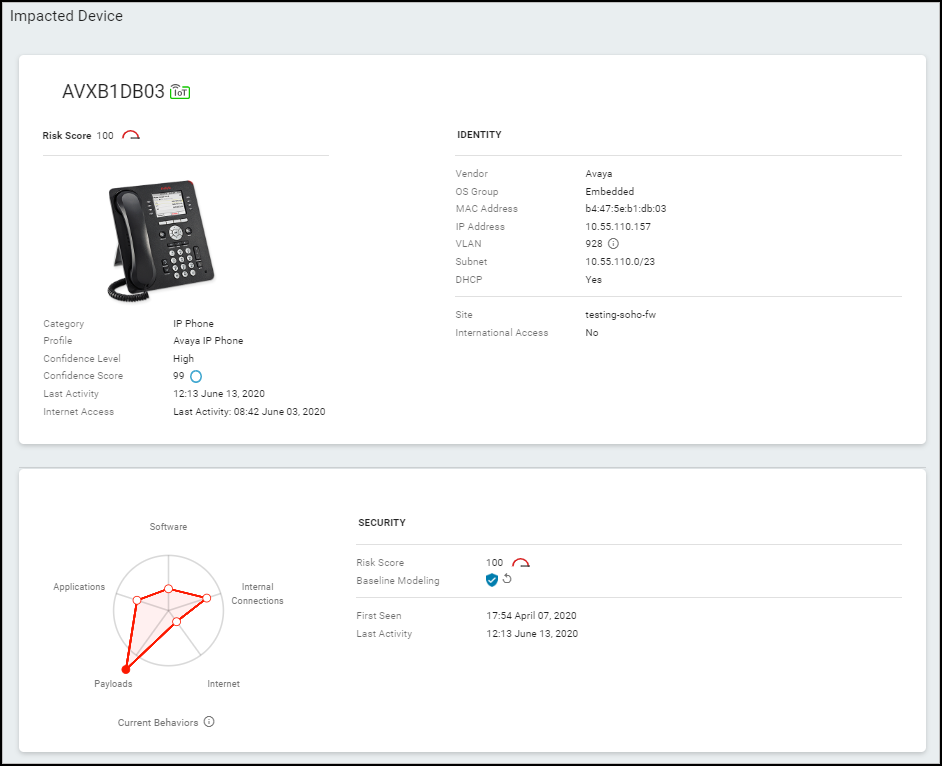
You can
learn about the identity and activity of the impacted device, its
physical location (site), and its logical location on the network.
In the Current Behaviors diagram, hover your cursor over any of
the five small red circles or the information icon to see more information.
The Security section provides security-related information about
the device.
The third major section on the Alert Details page
shows a snapshot of the network traffic of the impacted device in
a Sankey diagram. The diagram includes the IP addresses of other
endpoints and the applications used in their communications. The
lines indicate various network connections. The ones in red represent
the connection involved in the high-severity alert.
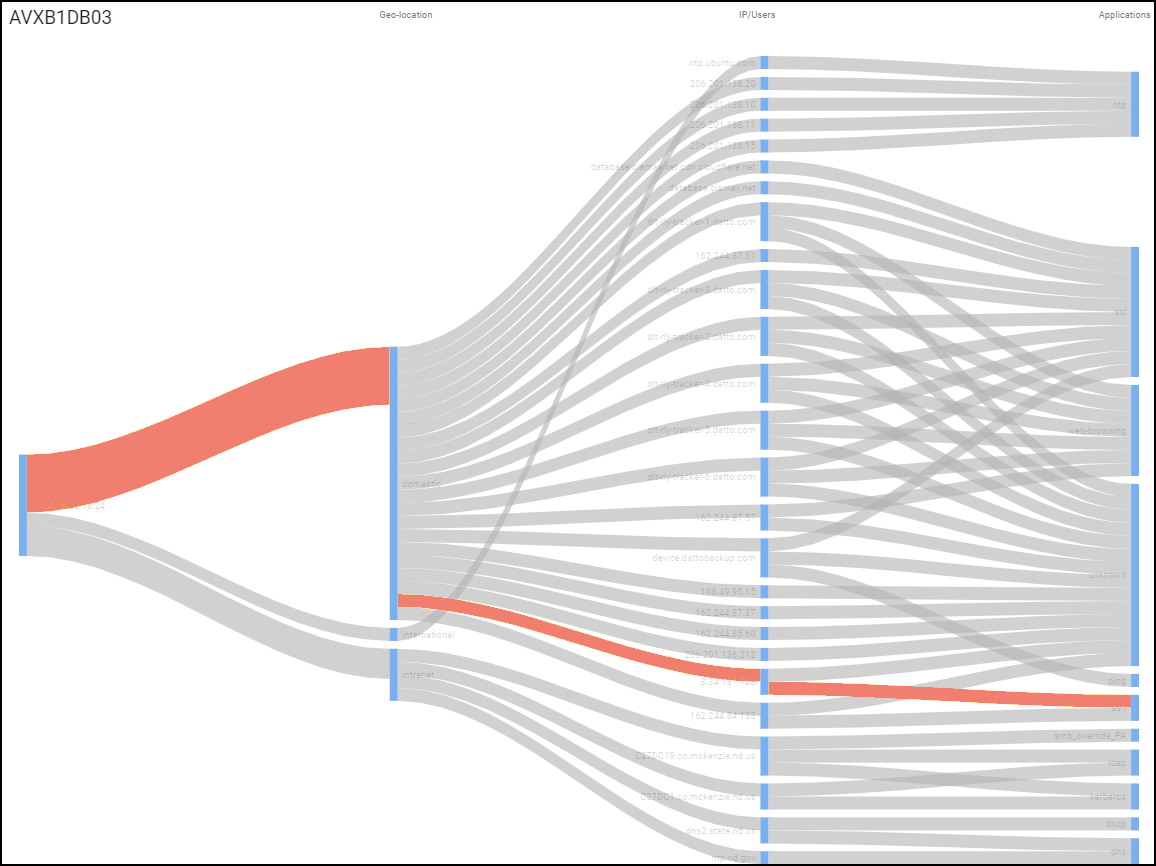
If
a device has multiple alerts, all relevant lines are colored according
to the severity of each one.
