Prisma Browser
Explore Prisma Browser Events
Table of Contents
Expand All
|
Collapse All
Prisma Browser Docs
Explore Prisma Browser Events
Use the Prisma Browser Events log to monitor activity within your Enterprise
Browser deployment.
| Where Can I Use This? | What Do I Need? |
|---|---|
|
|
The Prisma Browser Events screen is the key visibility tool for investigating
every activity within your Enterprise Browser deployment. Use this screen to assess
the state of your current deployment and ensure that your policy is working as
expected. From here, you can fine-tune the rules that define what actions you allow
your users to perform within the applications you allow. For example, suppose you
have set rules to block file downloads, but have enabled users to bypass this rule
and proceed anyway. From the Events screen, you can see every bypass event and
determine whether you need to refine the rule.
You can also view the browser events and audit logs from Strata Cloud Manager
Log Viewer. These
logs in Strata Logging Service can be
forwarded to Amazon Security Lake, AWS S3, and Snowflake.
To review Prisma Browser events:
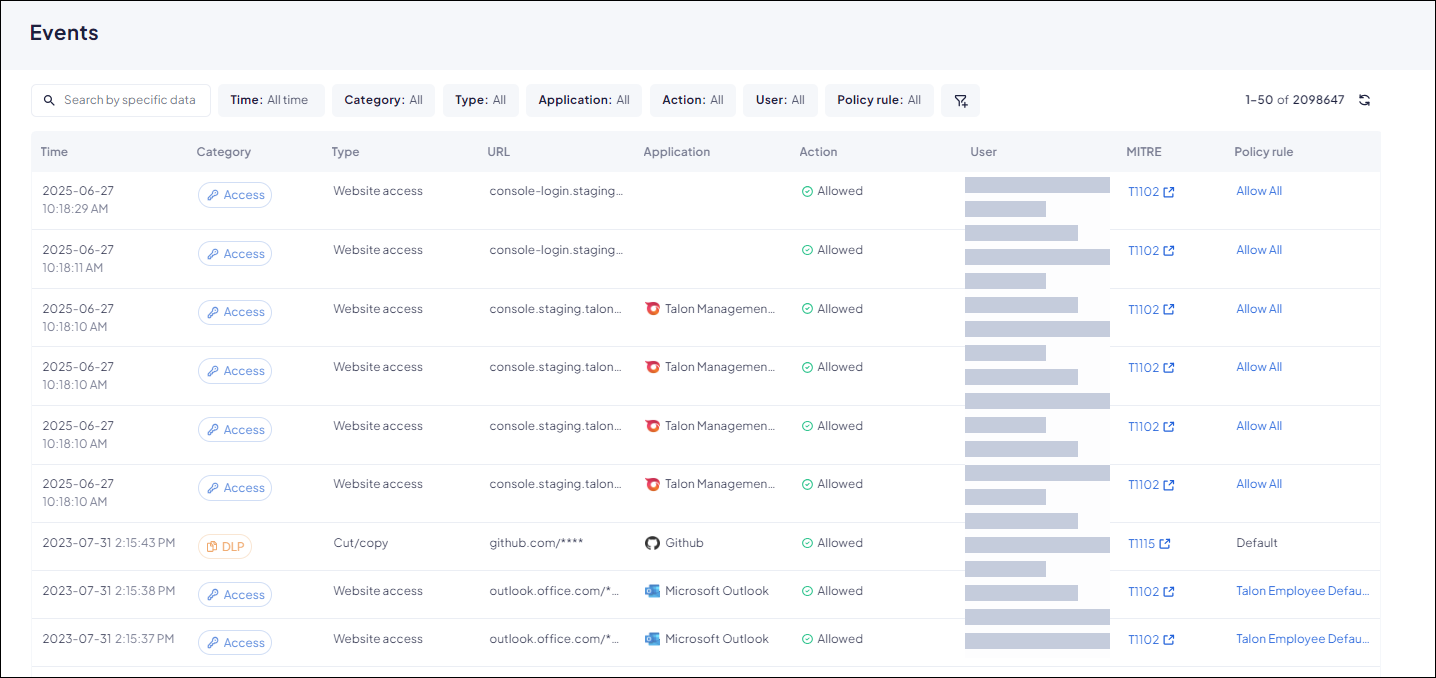
- From Strata Cloud Manager, select ConfigurationPrisma BrowserAnalyticsEvents.You can see the total number of events displayed at the top of the page. By default, the Events screen displays the 50 most recent events. Click Load 50 More to move to the next page of events.
![]() Investigate events using search and filters.An important part of your role with the Prisma Browser is analyzing events, and looking for patterns and anomalies in user behavior. Whenever you notice unexpected or unusual activity, you need to see if you need to tune the rules to meet the needs and requirements of the end users. The Prisma Browser allows you to search and filter the events to discover and analyze user behavior patterns. At the top of the screen, you can search for specific events using specific data to help find a particular event. You can also narrow the list of events by filtering on any of the following Events screen columns:
Investigate events using search and filters.An important part of your role with the Prisma Browser is analyzing events, and looking for patterns and anomalies in user behavior. Whenever you notice unexpected or unusual activity, you need to see if you need to tune the rules to meet the needs and requirements of the end users. The Prisma Browser allows you to search and filter the events to discover and analyze user behavior patterns. At the top of the screen, you can search for specific events using specific data to help find a particular event. You can also narrow the list of events by filtering on any of the following Events screen columns:- Time—Select a predefined time period for which to display events, or create a Custom time period.
- Category—Narrow down the type of events displayed by selecting
one or more categories. Available event categories include:
- Access—Events involving access to websites and apps.
- DLP—Events involving file upload, file download, and clipboard controls (copy/paste)
- Extensions—Events involving installation, removal, enabling, and disabling extensions.
- PIN Code—Events involving access to apps and features that require a PIN code or authorization.
- Malware—Incidents involving attempted access to malicious websites.
- Tampering—Incidents involving unauthorized file tampering.
- Type—The type of action that triggered the event log. The event types vary by category.
- URL—The URL associated with the event.
- App/Extension—The application or extension associated with the event.
- Action—The action that is associated with the event.
- User—The user associated with the event.
- MITRE—The MITRE ATT&CK technique related to the event.
- Policy rule—The policy rule that generated the event.
- Recording—Indicates if a recording is available.
You can also add additional filters to narrow down the events to display:- Event recordings—Show only events that have screen recordings.
- Web classifications—Filter by types of web applications controlled by the policy rule that triggered the event.
- Device—Filter events based on the device where the event originated.
- Browser brand—Filter the events by the browser brand.
- Browser version—Filter the events based on the version of the browser where the event originated.
- Browser type—Filter the events based on the browser where the event originated.
- Device groups—Filter the events by the device group.
- OS platform—Filter the event based on the operating system on the device where the event originated.
- User group—Filter the events based on the user group to which the users belong.
- MITRE—Filter the events based on the MITRE ATT&CK Mitigation resource.
- Compliance—Compliance Filter the events based on compliance issues (for example HIPAA, SOC 2, PCI DSS).
- Mode—The behavior of the policy rule as applied to end users.
- Is incident—Filter whether or not the event is an incident.
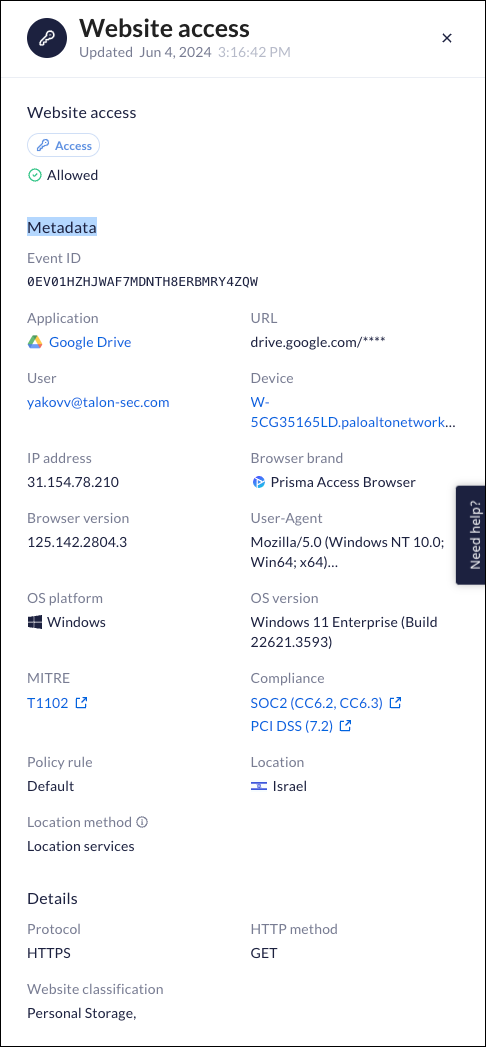
Click into an event to view details about the event.![]() There are additional sources of information that you can investigate here.
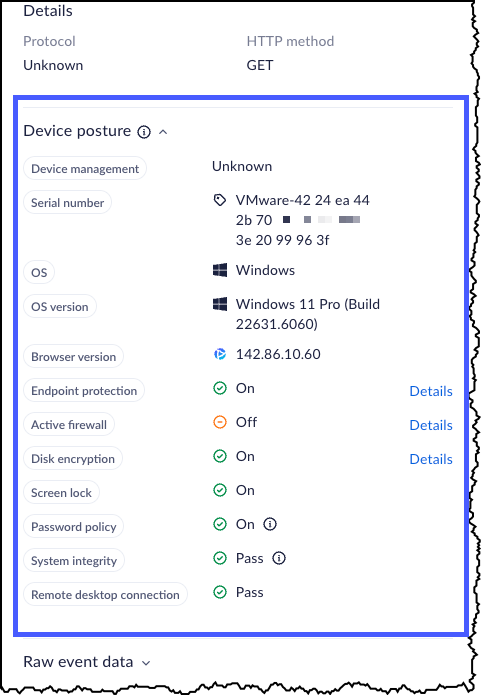
There are additional sources of information that you can investigate here.- Device Posture - The device security posture and the metadata
information collected t the time of this event.
![]()
- The following Posture details are available:
- Endpoint protection
- Active firewall
- Disk encryption
- Screen lock
- Password policy
- System integrity
- Remote desktop connection
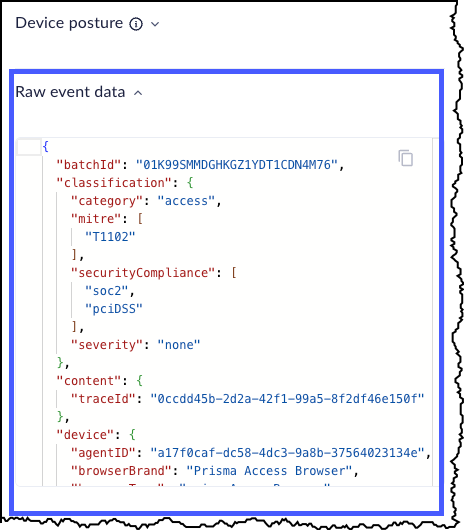
- Raw Data - The raw data associated with this event.
![]()
Export events for offline investigation.- Click the Export icon.In the Export window, select one of the following options:
- Export all available events—Export all the events in the database (up to a maximum of the 10,000 most recent events).
- Export filtered or searched events—Export events based on the current filters.
Tenant Visibility for SaaS Apps
The Prisma Browser enhances visibility into SaaS usage by detecting and reporting the logged-in tenant when a user signs in to supported applications. This feature helps administrators identify which tenants employees are accessing, enabling better control over unsanctioned or unapproved tenants.By capturing tenant-level details, administrators gain actionable insights to strengthen governance and reduce the risk of shadow IT.Supported Applications and Collected DataPrisma Browser and Prisma Browser Extension currently support tenant visibility for the following SaaS applications:- Google Workspace - Tenant domain
- Microsoft Office 365 - Tenant domain
- Slack - Tenant domain, workspace name, workspace id, channel id
- Amazon Web Services - Region, account id
Event Data AccessThe system records tenant detection data and makes it available in two locations:- Collected tenant data appears in the Event drawer in the browser.
- If SIEM integration is enabled, the collected data is forwarded to the customer's SIEM for centralized monitoring.
Detection Behavior
Prisma Browser uses application-specific detection strategies. These strategies may rely on:- URLs
- Cookies
- Local storage
- Network events
Because SaaS providers frequently update their applications, detection accuracy may vary if the provider changes how information is shared with the browser.Key Points
- Login dependency: A tenant is detected only when the user actively signs in to the application.
- Example: Applications such as Google Gemini or google.com may not trigger detection since they do not always require a login.
- Event variations: Some behaviors can cause tenant detection to fail:
- Forced reauthentication: If a user opens their laptop and Outlook redirects immediately to a sign-in page, Prisma Browser logs a website access event without tenant details.
- Fast redirection: In certain Outlook versions, when a file download triggers a new tab and immediate redirect, the process may bypass tenant detection.
If a user is redirected to sign in immediately after opening an app like Outlook, the system logs a "website access" event but does not capture tenant information. This is due to the user needing to reauthenticate before a new session can be established.Real-Time Analysis for Malicious Sites
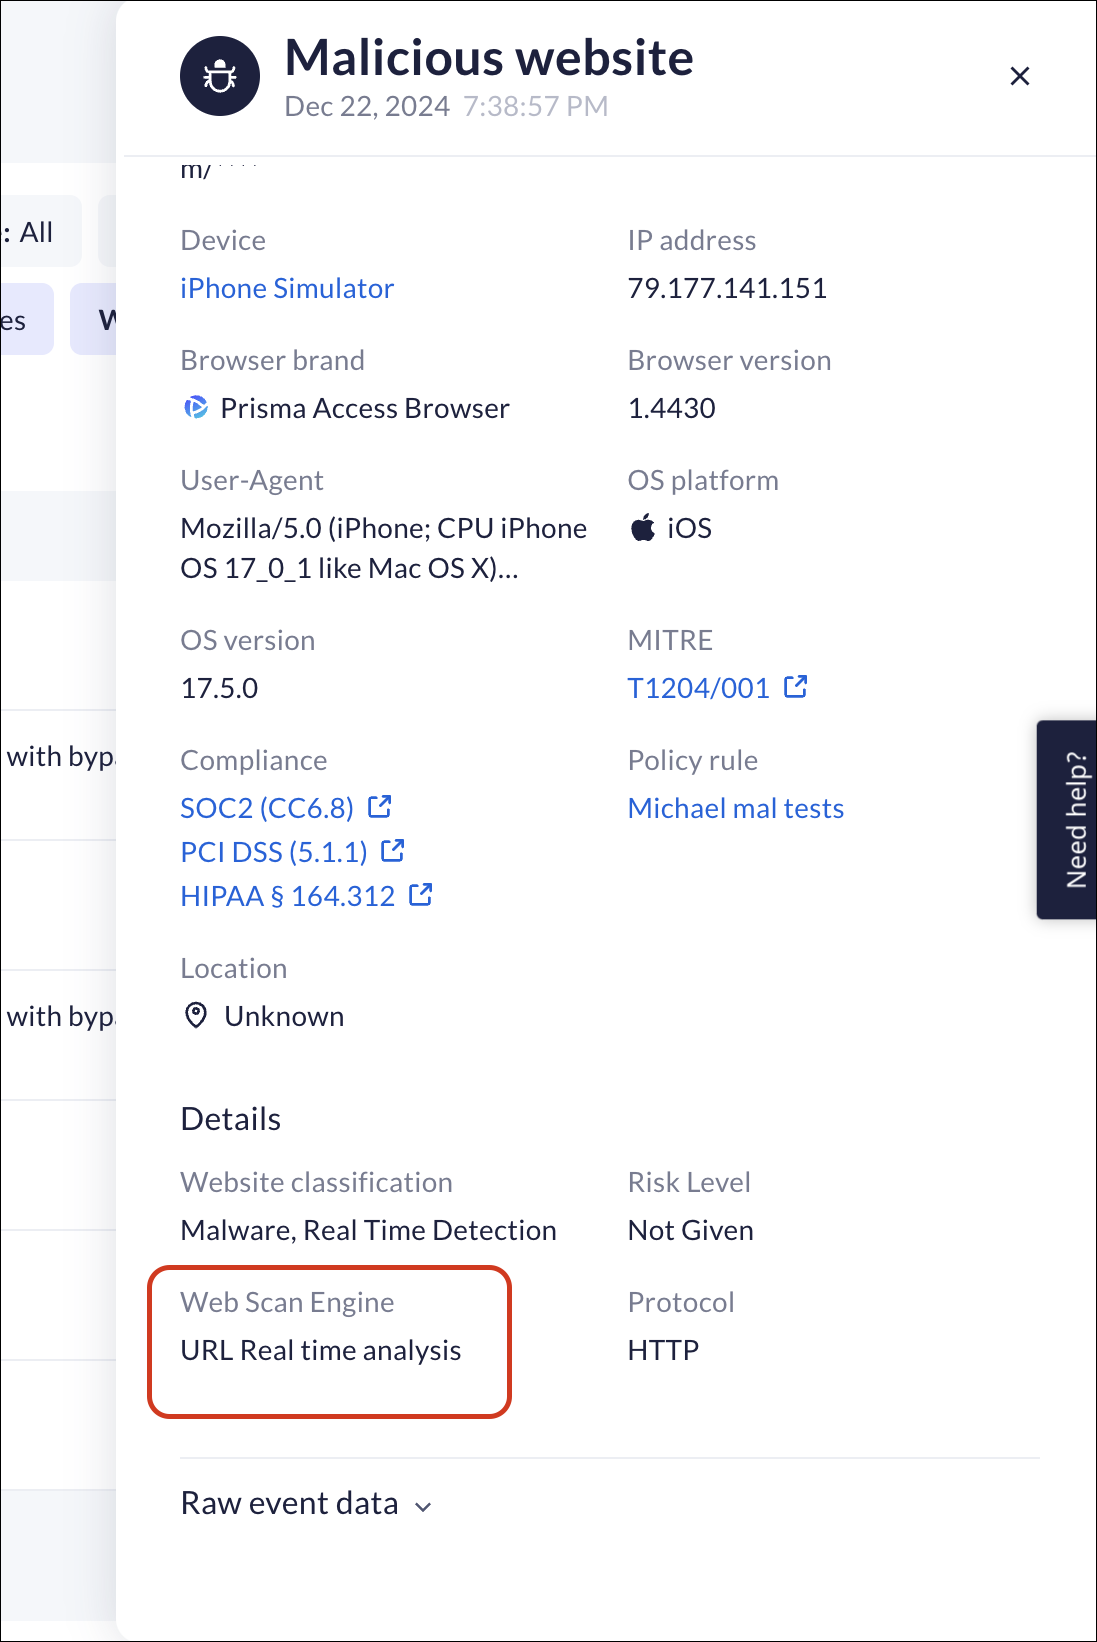
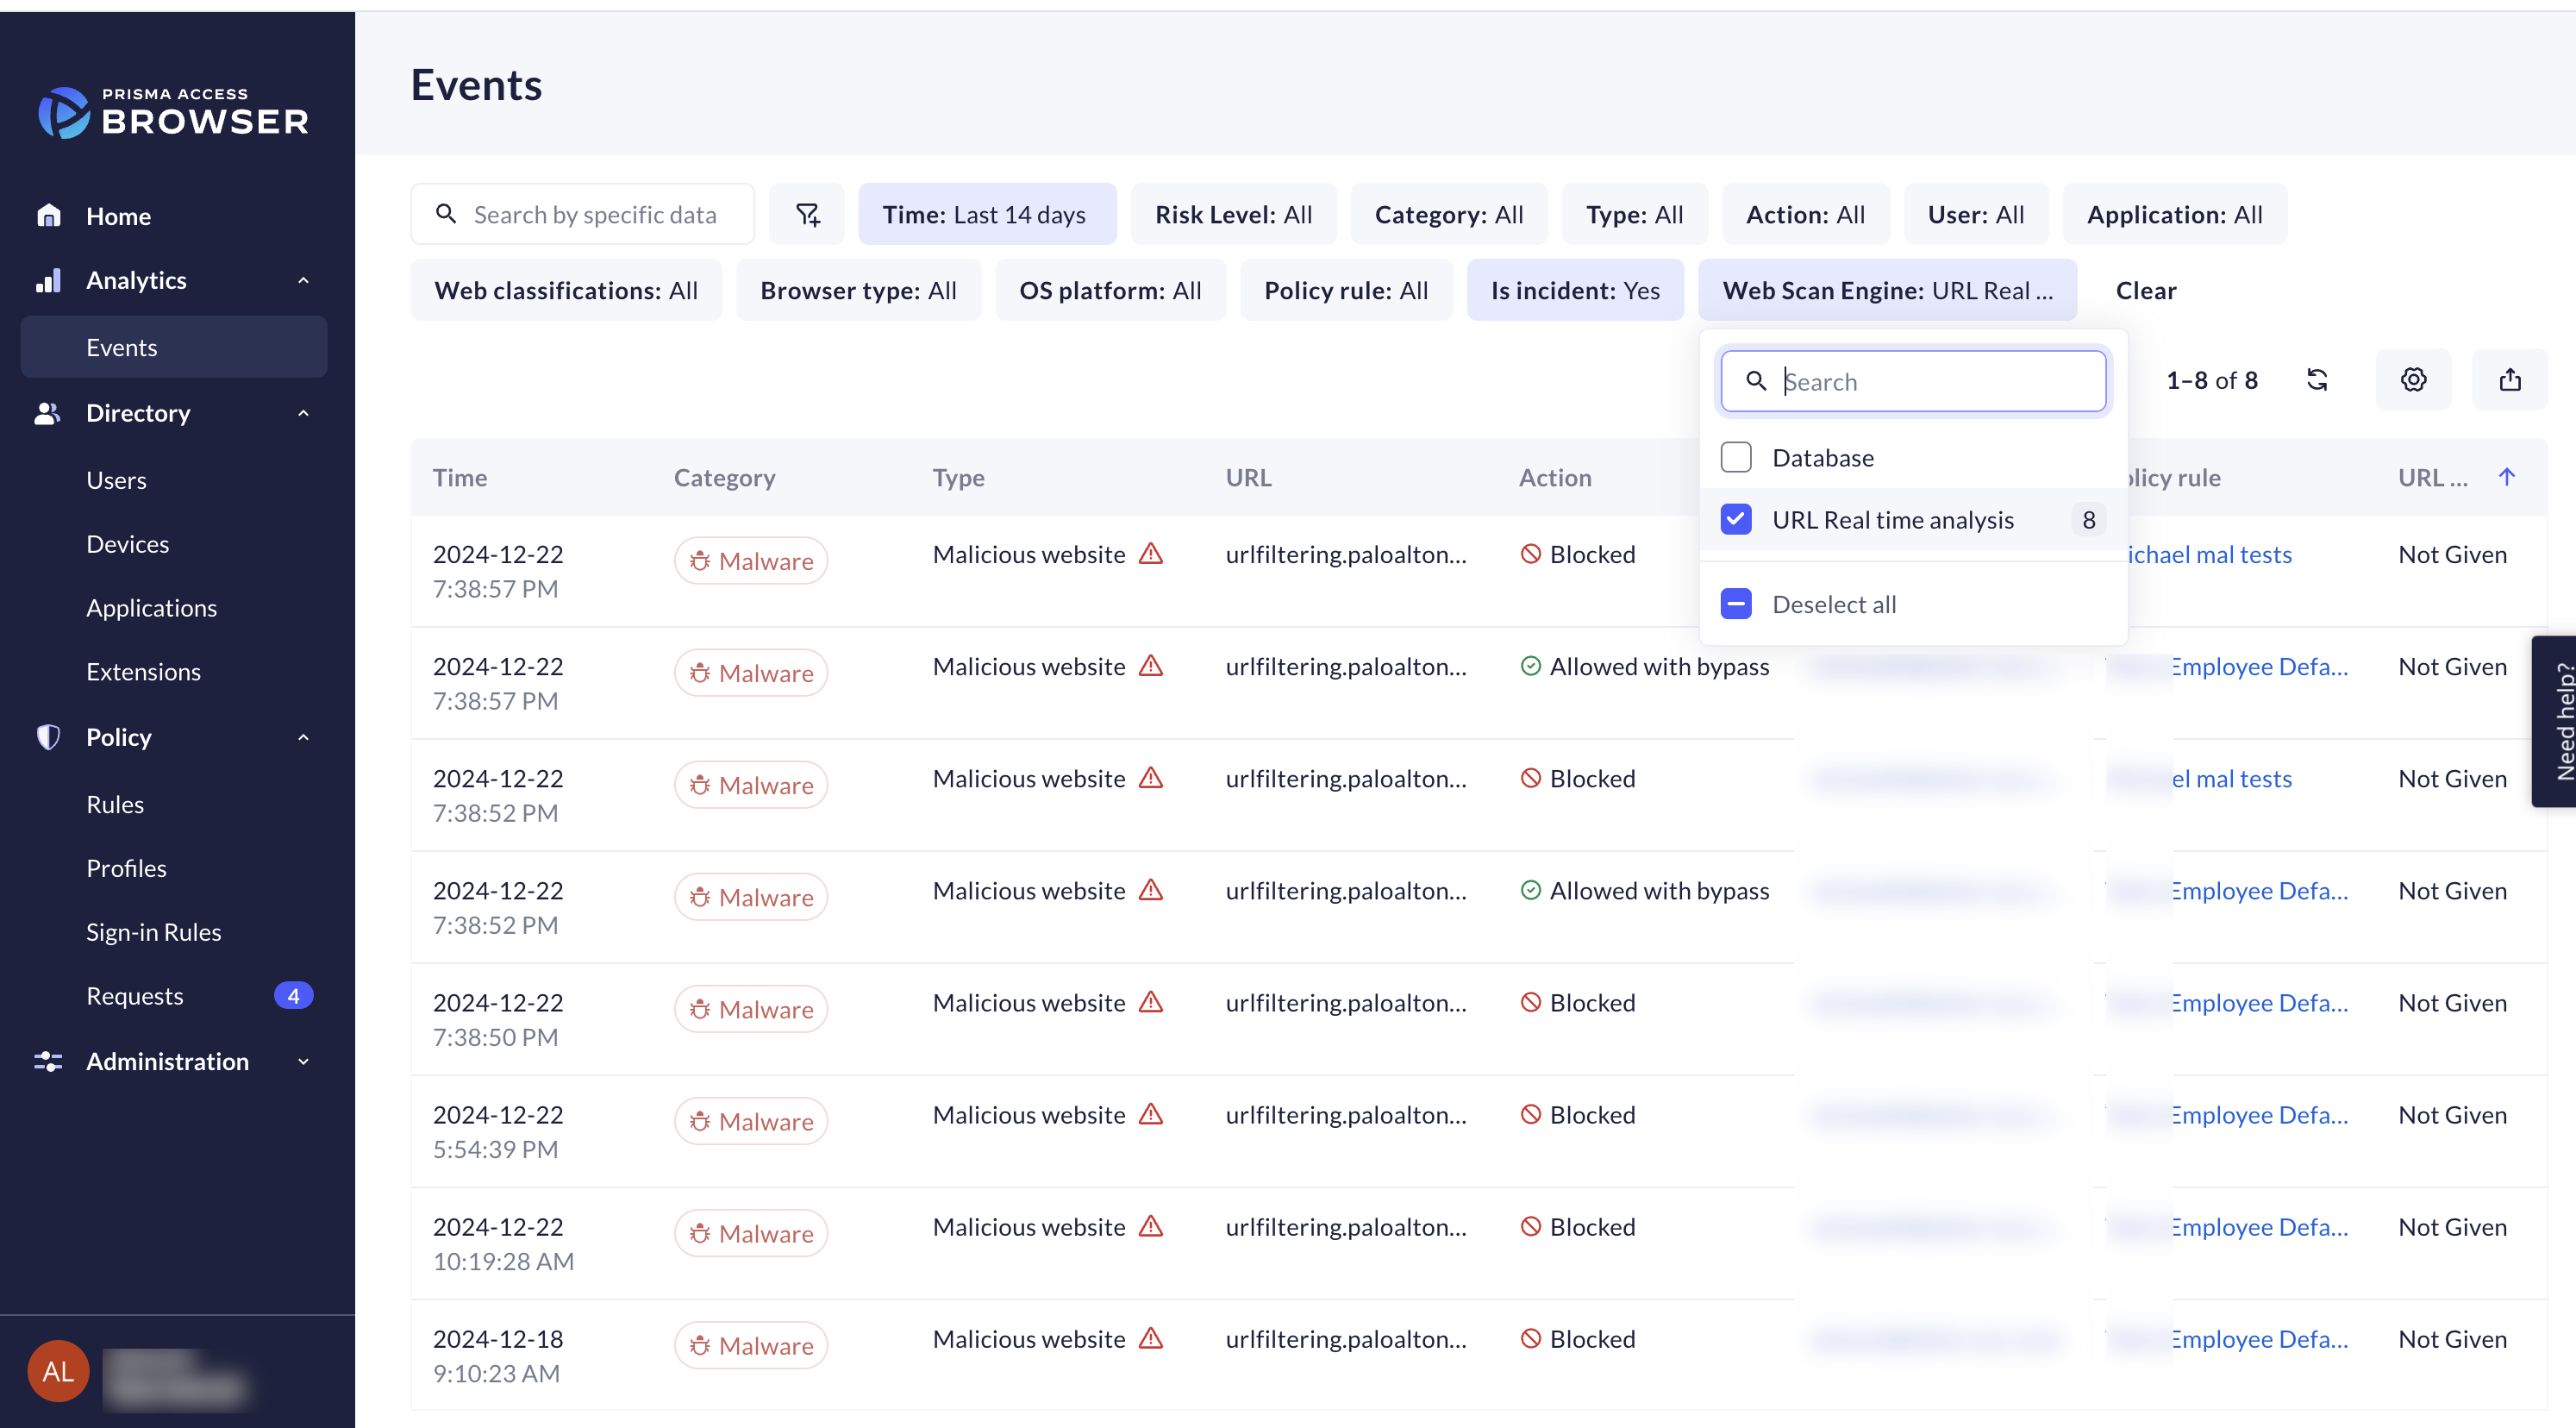
This task describes the Real time analysis engine. The Prisma Browser has a Web Scan engine that scans URLs in real-time. The results of the scan are used to determine whether the URL is malicious or not. The browser uses the Phobos Real-Time Analysis or the Palo Alto Networks database (PAN-DB).The particular tool that catches the malicious URL is displayed in the Event log and in the drawer. You can filter the log for the selected analysis tool.![]()
![]()
Screenshots
This task describes how to use event screenshots. You can configure the Prisma Browser to take screenshots of the activities that were preselected. This allows you to see the direct actions that your users perform in the browser, increasing the effectiveness of your monitoring and management capabilities.The screenshots are based solely on the information that you configure to provide more enhanced visibility and monitoring. The information belongs to you. Neither Palo Alto Networks not its employees have access to the recordings.Screenshots are only captured within the browser box. The screenshot does NOT include:- tabs
- content from tabs not currently in focus
- areas outside the tab
- the omnibox
Enable Screenshots
- Create or edit an Access & Data Control rule.At the Log Level step, select Enhanced.Click Screenshots.
Viewing Screenshots
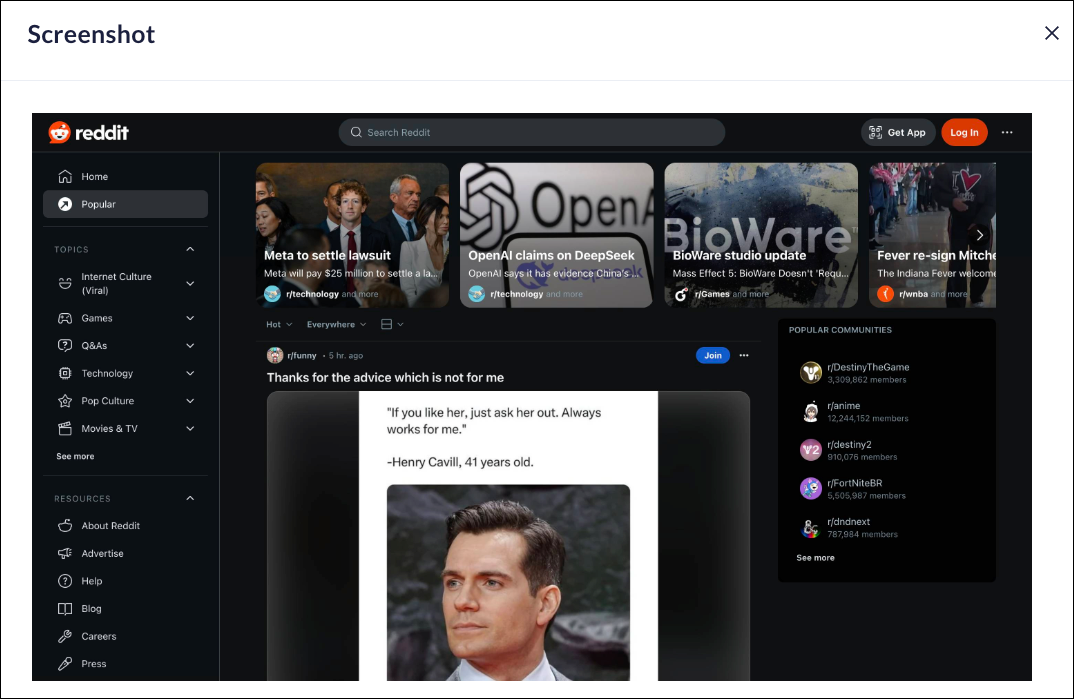
- The screenshots are available in the Event Drawer. Locate the event that contains the recording, open the Drawer, and click the Screenshot icon.
![]() The screenshot will display in a separate window.
The screenshot will display in a separate window.![]() For each configured action, the Prisma Browser will take another screenshot. This provides additional images of the user's experience, so you can see exactly what actions a user performed. For example, if you set rules against copyinig information from ChatGPT, there will be a screenshot when you open the page, and another when you copy information.
For each configured action, the Prisma Browser will take another screenshot. This provides additional images of the user's experience, so you can see exactly what actions a user performed. For example, if you set rules against copyinig information from ChatGPT, there will be a screenshot when you open the page, and another when you copy information.Current Screenshot Retention Policy
This task describes the retention policy for the screen recordings. Palo Alto Networks retains the screenshots for an indefinite length of time in our own dedicated storage. This means that you can review the user's actions long after the actual event took place. With this retention policy, you can also use the information to examine a user's behavior over a long period.

