Remote Browser Isolation
Monitor Remote Browser Isolation
Table of Contents
Monitor Remote Browser Isolation
View and monitor Remote Browser Isolation users using Strata Cloud Manager.
| Where Can I Use This? | What Do I Need? |
|---|---|
|
|
You can use Strata Cloud Manager to get comprehensive visibility across your network
traffic and for Remote Browser Isolation (RBI) by using the Monitor and Workflows sections of Strata Cloud Manager.
Gain visibility into your RBI deployment by viewing metrics such as the number of active
RBI users, trends, connectivity status, RBI location status, traffic measurements, and license consumption. By viewing data about
your users, you can get an overall picture of the health and connectivity of your
deployment.
NetSec Health Dashboard
Select InsightsNetSec Health to monitor the overall health of your Mobile Users who are currently
connected to Prisma Access.
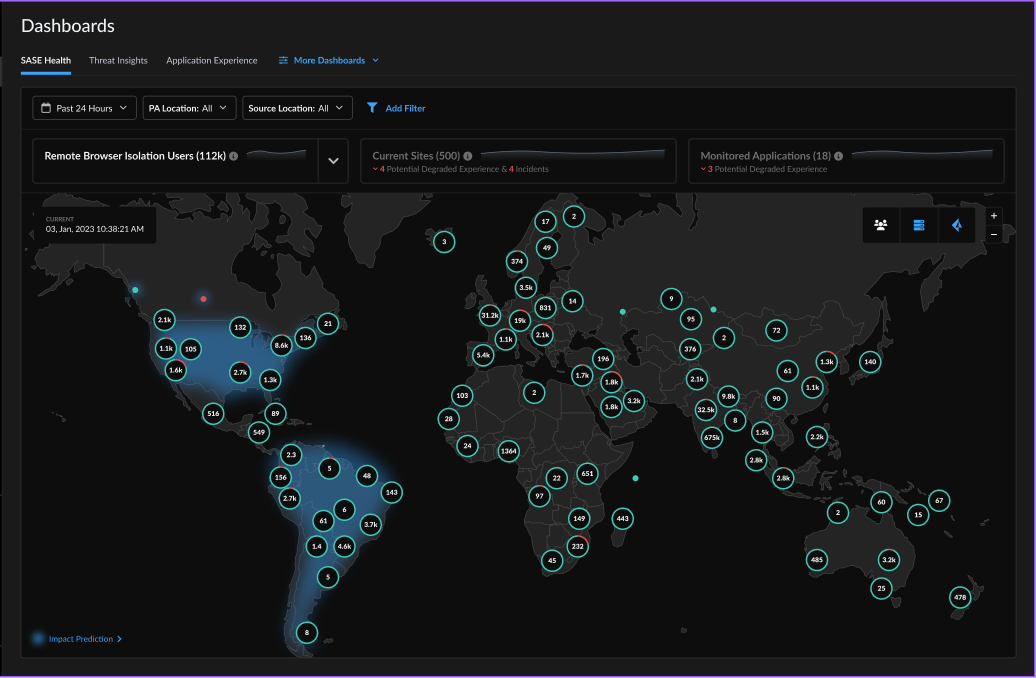
Select Remote Browser Isolation Users to show the overall
health of RBI users who are currently connected to Prisma Access. The numbers in the circles represent the number of users or sites
that are currently connected from the Prisma Access Location where they appear.
A dot represents a single user or site. The areas on the map that have a blue
background indicate that the numbers shown in that region are a prediction or
forecast.
You can filter the data shown in this dashboard with one or more of the following
filters:
- Time Range
- Prisma Access Location
- Source Location
Monitor RBI Users
Select InsightsActivity InsightsUsers to view Remote Browser Isolation (RBI) users who connect to Prisma Access security services through Prisma Access connection methods such as
GlobalProtect and Explicit Proxy.

You can view the following connectivity data:
- Connection Method—Select Remote Browser Isolation to view data about your RBI users.
- Filters—You can filter users by:
- Time Range
- Connected Method
- User Name
- Prisma Access Location
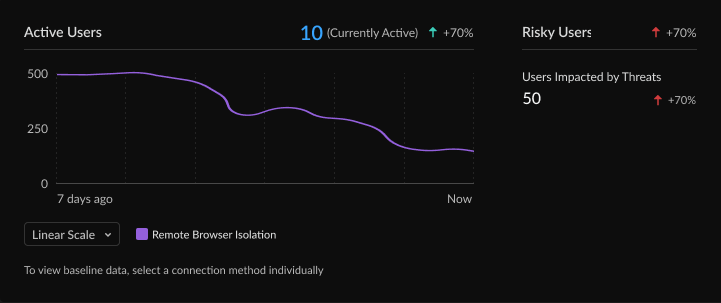
- Active Users—Shows the number of RBI users connected to Prisma Access locations in the Time Range that you selected. Hover your cursor over a point on the chart to view the number of users at a specific time. Knowing the user trends over a specific period of time can help you monitor usage, and investigate any unusual patterns. For example, if there is a decline in usage, you might check to see if your users are experiencing browser performance issues.
![]()
- Risky Users—Shows the number of Active Users impacted by threats. The up or down or arrow compares this time range with a previous time range to determine the difference, in percentage, of the number of connected devices. For example, you can monitor the change in percentage or risky users to determine if it's time to alert your users about risky browsing habits, or to adjust the isolation settings for certain website categories.
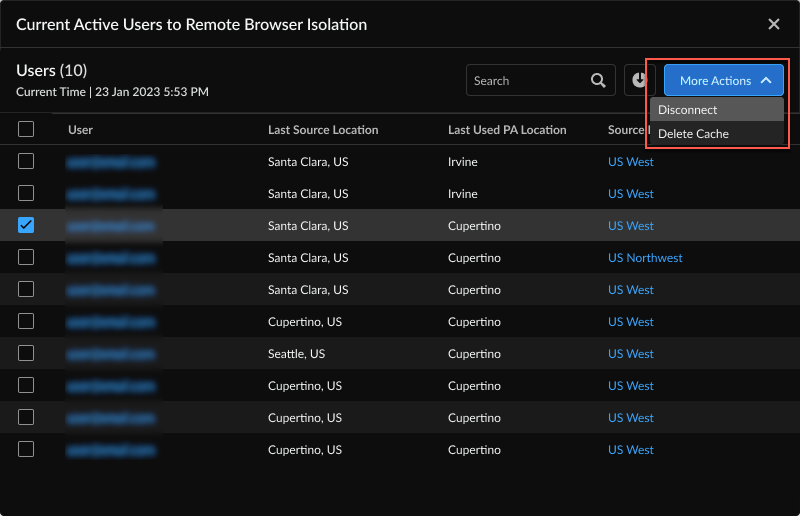
- Currently Active—Shows the number of RBI users who are currently in isolated browsing sessions. Click the number to open a pop-up window that shows the list of currently active users in more detail, including the User, Last Source Location, Last Used PA Location, and Source IP.
![]() From this window, you can perform the following actions:
From this window, you can perform the following actions:- Select More ActionsDisconnect to disconnect a user from Remote Browser Isolation
- Select More ActionsDelete Cache to delete the browser cache on the user's remote isolation browser
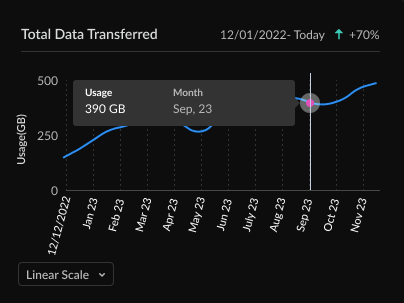
- Total Data Transferred—Shows the amount of data transferred during browsing sessions for all RBI users.
- Select Count from the drop-down to show the aggregate data usage over a period of one year.
- Select Linear Scale from the drop-down to show the trend for the amount of data transferred during isolated browsing sessions by all connected RBI users over a period of one year. Hover your cursor over a point on the chart to view the data usage for a specific month.
![]()
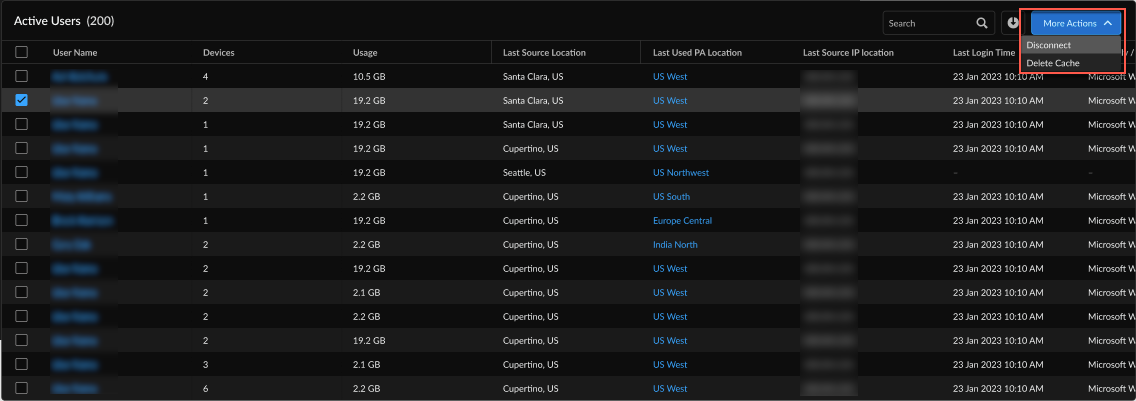
- Active Users table—Shows the list of users who were logged in during the selected Time Range. For each user, you can view:
- The number of devices used for isolated browsing
- The amount of data used
- The last source location
- The last used Prisma Access location
- The last source IP address
- The last login time
- The operating system and OS version they are running
![]() Using More Actions, you can also Disconnect a user from Remote Browser Isolation or Delete Cache to delete the user's isolation browser cache.To view more details about a user, select any Active User from the table.
Using More Actions, you can also Disconnect a user from Remote Browser Isolation or Delete Cache to delete the user's isolation browser cache.To view more details about a user, select any Active User from the table.
Monitor Prisma Access Locations with RBI
Select InsightsPrisma Access Locations to view the overall health of all your Prisma Access
locations.
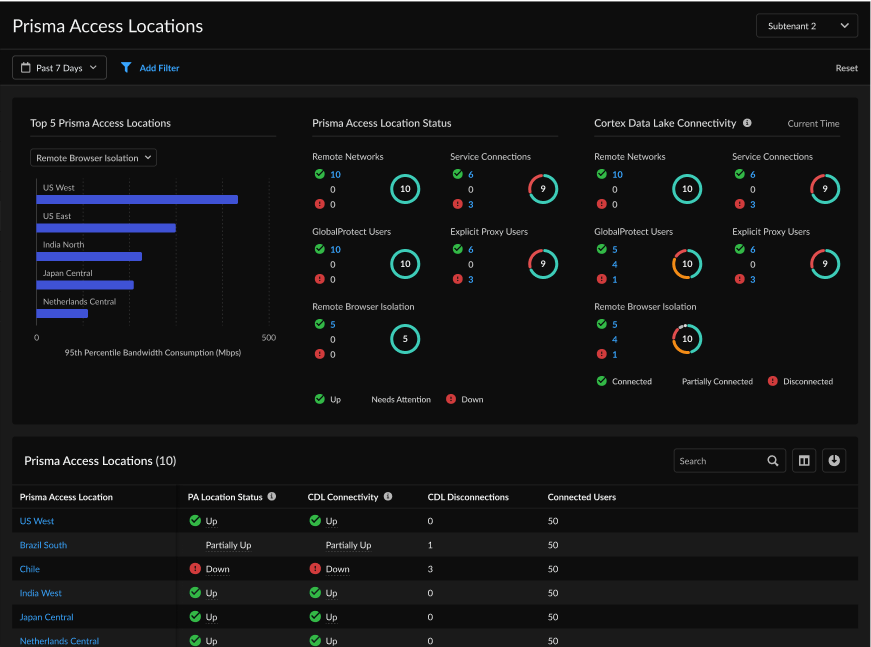
You can view the following data:
- Top 5 Prisma Access Locations—Select Remote Browser Isolation from the drop-down to show a bar graph with data about the top five Prisma Access locations used for RBI based on the total bandwidth consumed during the selected Time Range.
- Prisma Access Location Status—Depending on your license, this widget shows the number of connected Remote Network sites, Service Connection sites, unique GlobalProtect Users, unique Explicit Proxy Users, and unique Remote Browser Isolation users logged in to Prisma Access. The Time Range selection filter does not apply to this widget.The widget's color code is based on how many users in each category are in the following status:
- Connected (green): All Prisma Access Locations are connected.
- Disconnected (red): All Prisma Access Locations are connected.
- Partially Connected (orange): One or more Prisma Access Locations are disconnected.
- Strata Logging Service Connectivity—This widget gives you visibility into the Strata Logging Service connectivity health status from all your Prisma Access instances for the Strata Logging Service region that you selected during your Prisma Access license activation. It helps you determine if firewalls have disconnected from Strata Logging Service and you are no longer obtaining firewall logs. Each tenant can connect to only one Strata Logging Service in any region of its choice. Prisma Access polls the Strata Logging Service database every 5 minutes to check for connectivity between the nodes (Remote Networks, Service Connections, GlobalProtect Users, Explicit Proxy Users, and RBI) and the Strata Logging Service database.
- Prisma Access Location Status—Shows the status of the Prisma Access locations in real time. Within a specific location, if a user logs in from multiple hosts, the user is counted as a single user. However, if any user logs in from two different Prisma Access locations by disconnecting from one and logging in from another within the time period, the user is counted as two users. Select a location to view details, such as bandwidth consumed, status, Strata Logging Service Connectivity, and user ID and group mappings.
RBI User Details
In addition to an aggregate view of users, you can view detailed information
about individual RBI users by selecting MonitorUsersConnection MethodRemote Browser Isolation and selecting a user from the Active Users
table.

Threats
In the user details page, you can select Threats to view a
summary of the user's URL category browsing, including:
- URL Category Browsing Summary - Data Transfer—Shows a summary of URL categories the user accessed and the data transferred during those isolated browsing sessions. You can view this summary By Data Transfer or By Session Count.
- TOP 10 URL CATEGORIES—Shows the top 10 URL categories that the user accessed, sorted by the amount of data transferred.
- Total Data Transferred—Shows the total data transferred
during isolated browsing for a user.
![]()
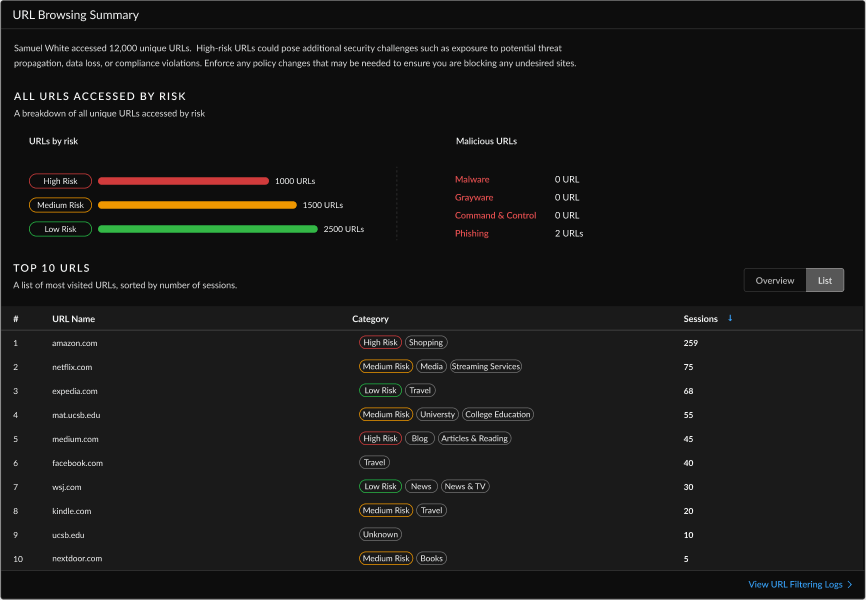
- URL Browsing Summary—Shows a summary of the user's URL
browsing history that includes the number of URLs visited sorted by risk, and
the top 10 most visited URLs sorted by the number of sessions visiting those
URLs.
![]()
Connectivity
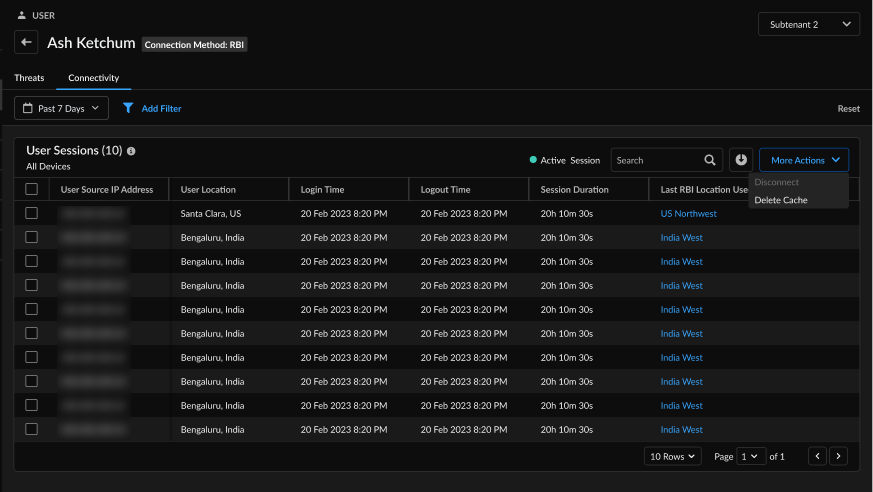
In the user details page, select Connectivity to view a table
listing the User Sessions for the user. You can sort on the
source IP address of the user's device, the user location, the login time, the
logout time, session duration, and the last RBI location used. You can also select More ActionsDelete Cache to clear the cache on the user's isolated browser. A green dot
indicates an active RBI session.
Monitor RBI License Consumption
You can monitor the RBI license consumption by selecting MonitorSubscription Usage. On the Subscription Usage page, scroll to the section for
Remote Browser Isolation.
The usage for RBI is a measure of the total unique users and
traffic consumed by RBI over a period of time. You can select
View Usage Details to go to the Users summary
page.
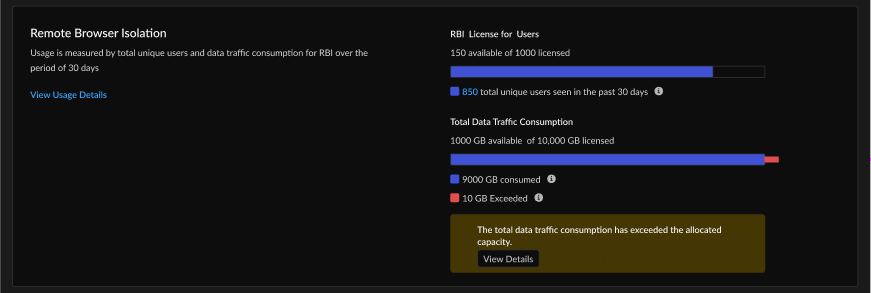
You can monitor license consumption data, such as:
- The number of available licenses consumed by RBI users.
- The total number of unique users seen over the last 30 days. A unique user is a user with a unique username who has logged in to Prisma Access at least once over a period of time.
- The total amount of data traffic consumed by all users.
- The amount of data usage that exceeded the capacity allocated by your RBI license.

