Strata Cloud Manager
Prisma SD-WAN Dashboard: Bandwidth Utilization
Table of Contents
Prisma SD-WAN Dashboard: Bandwidth Utilization
View the bandwidth utilization of the Prisma SD-WAN in a network.
| Where Can I Use This? | What Do I Need? |
|---|---|
|
The other licenses and prerequisites needed for visibility
are:
→ The features and capabilities available to you in Strata Cloud Manager depend on which license(s) you are
using.
|
The Bandwidth Utilization widget displays the
amount of bandwidth utilized on a trail in a network. It is a visual representation of
bandwidth spike, total bandwidth consumed by a particular site, and the application; if
the upload is in ingress, egress direction or both.
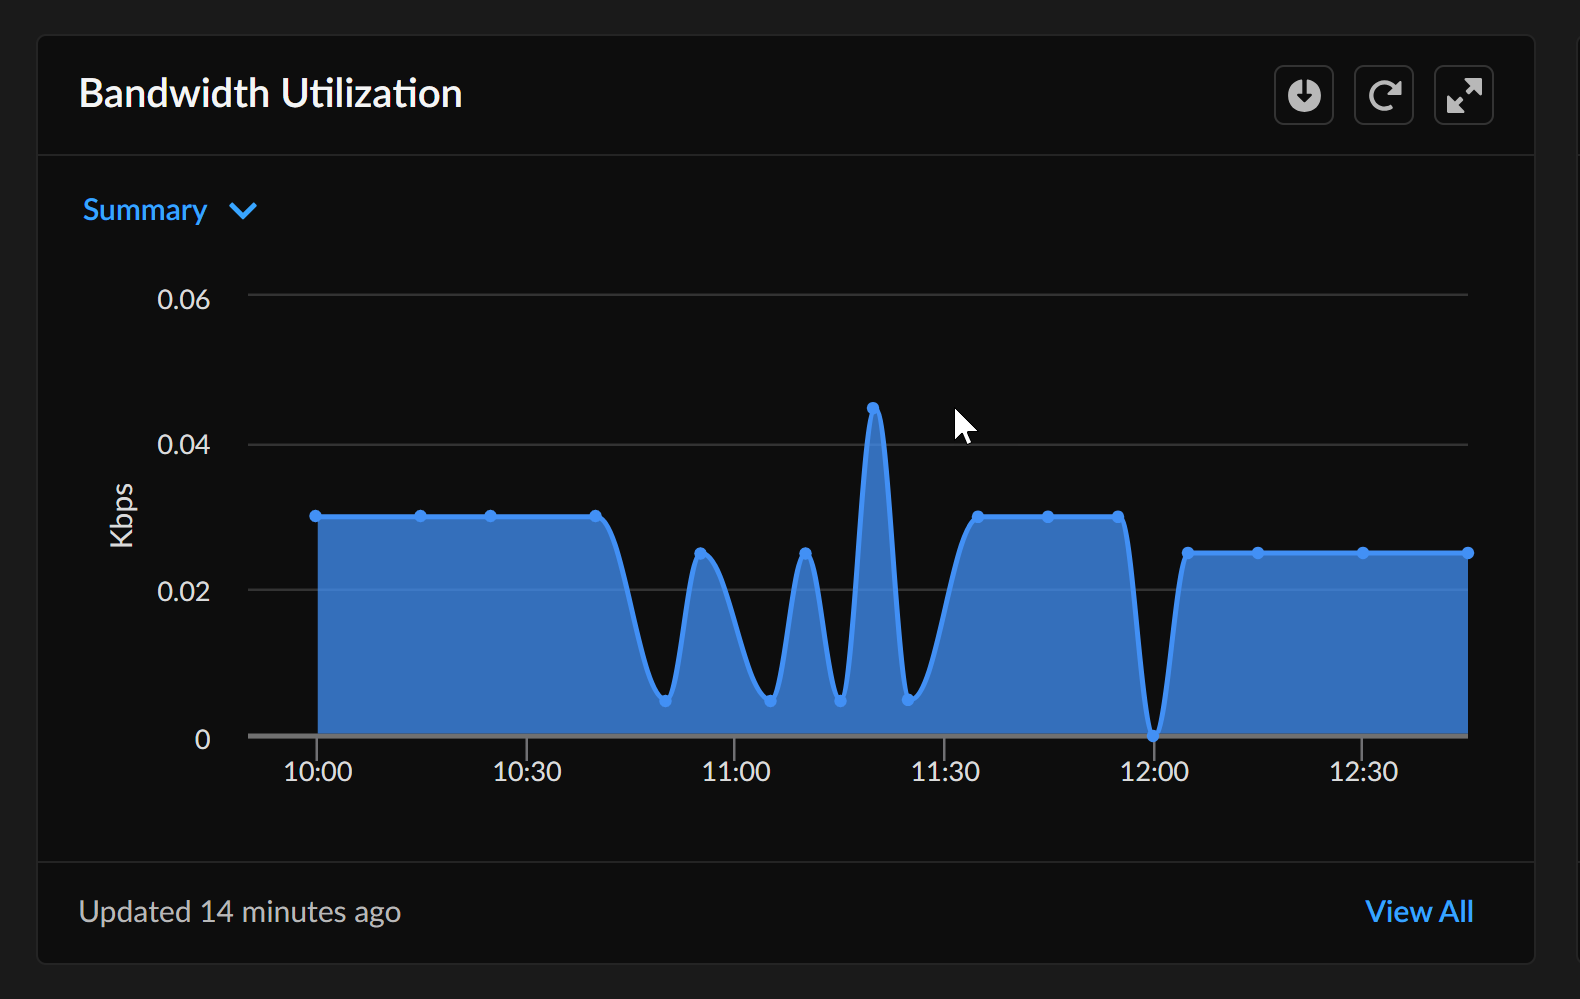
Move your cursor in the Bandwidth Utilization chart to get a more
granular view of the bandwidth utilization with an application or time-stamp. Typically,
the apps are listed in order of their bandwidth utilization. The chart displays the
bandwidth consumed over time. The 1H view provides granular per minute data, and the 1D
picture shows data every 5 minutes. The 1D chart data averages above 5 minutes for each
sample. If utilization sustains above 5 minutes, you can see the corresponding peak
utilization in both charts.
You can use the download option from the widget to download the Bandwidth Utilization
chart in either PDF, CSV, XLS, or PNG formats.