Prisma SD-WAN
Prisma SD-WAN Summary
Table of Contents
Prisma SD-WAN Summary
Let us learn about the Prisma SD-WAN summary dashboard.
| Where Can I Use This? | What Do I Need? |
|---|---|
|
|
The Prisma SD-WAN Dashboard provides a high-level summary and graphical view
of the Prisma SD-WAN Controller connectivity status of your branch and data center
devices and network insights of the branch sites across tenants. The dashboard displays
the link quality metrics across your sites and app utilization for the ingress and
egress traffic. The dashboard also shows the alarms generated and the status of
Autonomous DEM.
Prisma SD-WAN allows administrators to create policies by enabling dynamic path
selection using the highest-performing network and providing visibility into
applications and systems' availability and performance. The ION devices deployed in line
with the WAN edge in a network automatically detect the application and measure
application performance for each application flow.
This is the default screen when you first access the Prisma SD-WAN. The
data is refreshed every five (5) minutes.
The Dashboard displays the following charts:
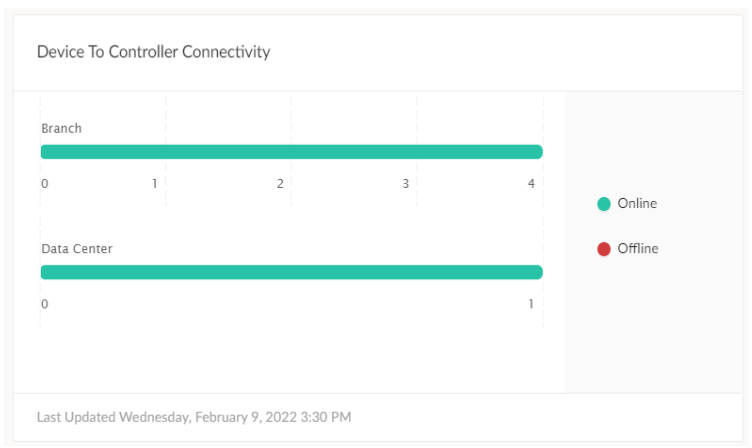
Device To Controller Connectivity
The Device To Controller Connectivity widget depicts the
number of Online and Offline ION devices connected to the Prisma SD-WAN controller
for a Branch and Data Center. Using this interactive graph, you can view the online
or offline status for a claimed device for the corresponding branch and data
center.
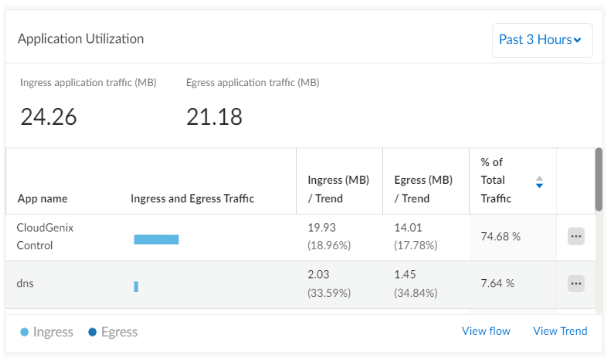
Application Utilization
The Application Utilization widget displays information about
the application utilization at the site during the period. The total application
ingress and egress traffic for the selected time range is displayed along with the
top 10 applications. The total bandwidth utilization, ingress, egress, and
percentage of total traffic are based on the bandwidth utilization for each
application. You can view flow information or time series utilization data can be
viewed by clicking the ellipses.
Network Insights from Past Week
The Network Insights from Past Week widget displays network
insights or reports for the past week. This widget displays insights for all branch
sites across a tenant. You can view insights for a branch site on the
Circuit Metrics widget on the Site Summary dashboard. For
more intelligent insights, subscribe to AIOps.
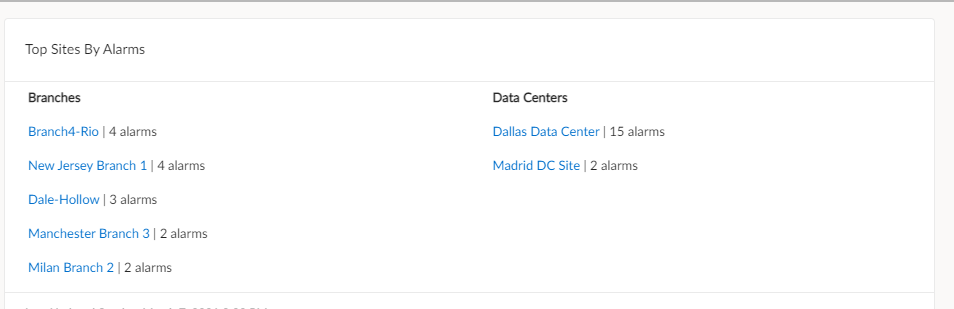
Top Sites By Alarms
The Top Sites By Alarms widget enables you to group your top
branch and data center sites with the number of alarms generated for the
corresponding site. You can click a branch or data center site to see all the alarms
generated under the Faults (Alarms) and Alerts.
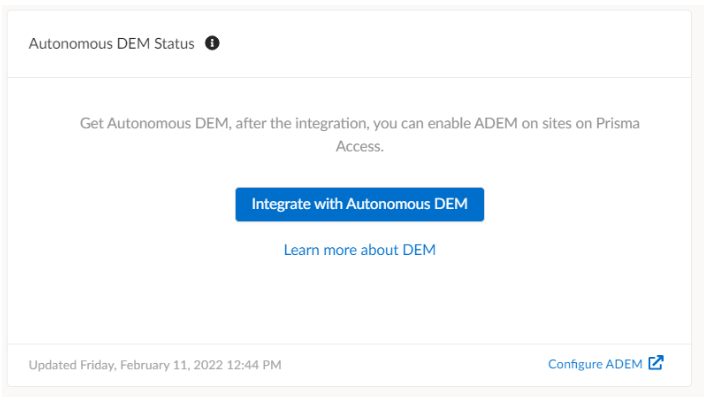
Autonomous DEM Status
The Autonomous Digital Experience Management (ADEM) monitoring
for Remote Networks agent is delivered from the Prisma SD-WAN device software. The
ADEM for Remote Networks agent provides visibility into cloud infrastructure
performance, application performance, and user traffic monitoring. This feature is
available if ADEM is enabled for a site.
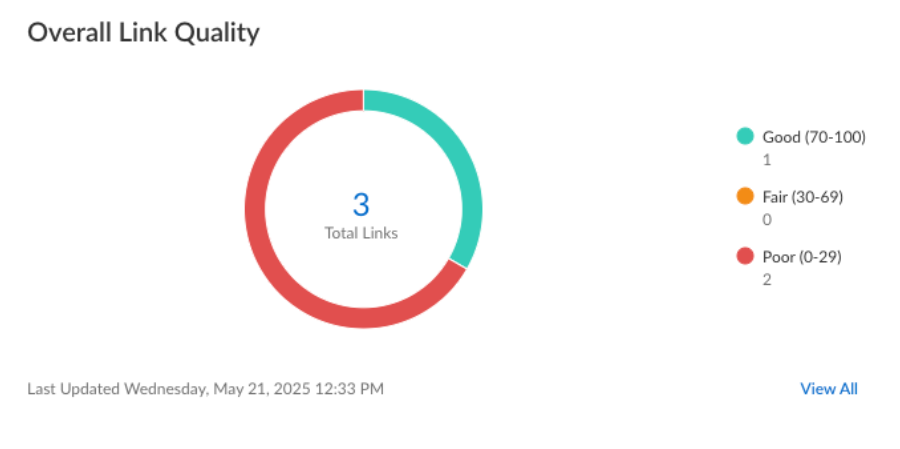
Link Quality Details
Based on thelink quality metrics chosen,
filter the data based on Interval, Start Time, Aggregation, and Direction. The
interactive dashboard allows you to change the metric to any other link quality
metrics to view the corresponding graphs. The last distribution range of the bar
graphs up to the 90th percent of the available data.
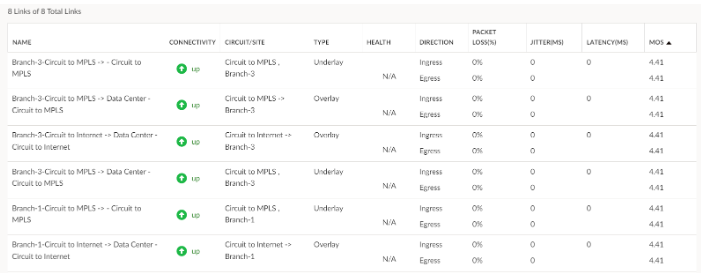
The active Links table lets you view all secure fabric links between two sites and
Circuit and WAN information. You can also view the link quality metrics and Link
Type for each link. You can sort the table information based on a particular link
quality metric displaying the corresponding worst value on top. Expand the site
detail to view the link quality metrics for ingress and egress flows. It enables you
to view the link quality chart per site and active path. The chosen site and path
are the pre-selected filter criteria for the Activity chart that displays the
corresponding information.
Bandwidth Utilization
The Bandwidth Utilization chart displays the
amount of bandwidth utilized on a trail in a network. Use the chart to identify WAN
congestion in a network that may hinder application performance. It is a visual
representation of bandwidth spike, total bandwidth consumed by a particular site,
and the application; if the upload is in ingress or egress direction.
Move your cursor in the Bandwidth Utilization chart to get a more granular view of
the bandwidth utilization with an application or time-stamp. Typically, the apps are
listed in order of their bandwidth utilization.
The chart displays the bandwidth consumed over time. The 1H
view provides granular per minute data, and the 1D picture
shows data every 5 minutes. The 1D chart data averages above 5 minutes for each
sample. If utilization sustains above 5 minutes, you can see the corresponding peak
utilization in both charts.
Select Circuits to view and narrow down the traffic by a
circuit path such as the Internet and Private
WAN.
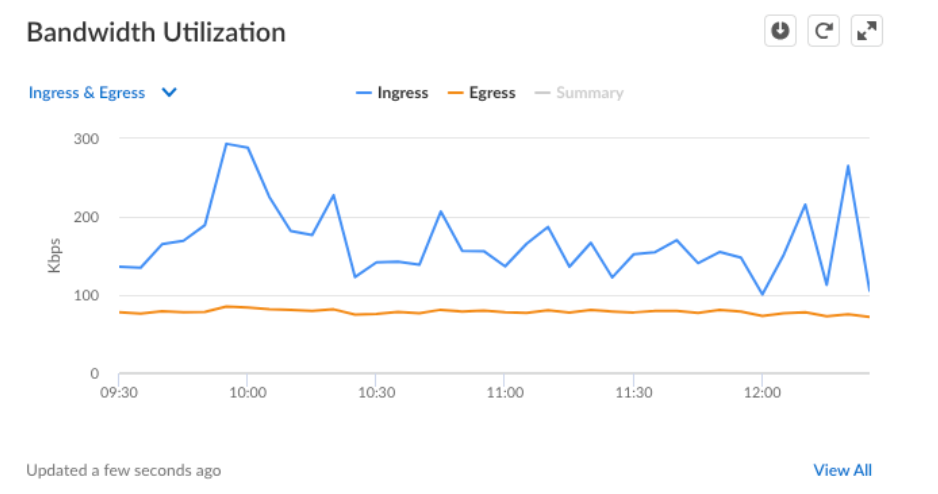
The broken line indicates the configured bandwidth for the selected circuit.
Transactional Stats
The Transaction Stats chart provides transaction
statistics on TCP flows, including initiation/transaction successes and failures for
a specific application or all applications, a particular path or all paths, and all
health events.
It measures the performance and availability of networks and
applications that run on network paths. For each request on a given path, Prisma SD-WAN monitors, in real-time, the transaction error rates for
initiation and data transfer transactions. You can view the list of
Apps by their bandwidth utilization or by path. You can
filter out successful transactions to get a granular view of transaction failure
stats.
The chart displays the count of successful or failed transactions for the following
categories:
- Init Sucessful—Successful completion of the three-way handshake.
- TXNs Sucessful—Successful transfer of data after the completion of the three-way handshake.
- Init Failure—Failure to complete the three-way handshake. Reasons for failure may include a misconfiguration firewall, an application server issue, a misconfiguration network access control list, or a WAN network provider issue.
- TXNs Failure—Unsuccessful transfer of data after the completion of the three-way handshake. Reasons for failure can include a mis-configured firewall, an application server issue, a mis-configured network access control list, or a WAN network provider issue.
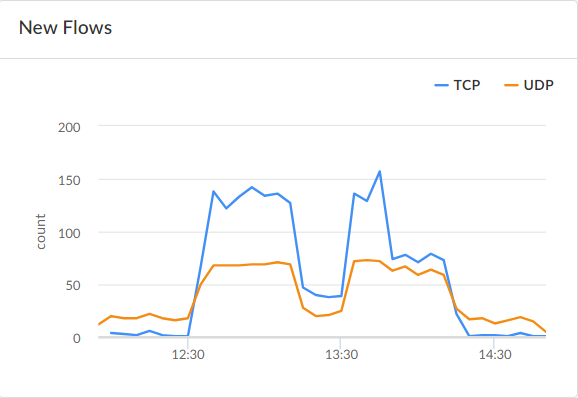
New Flows
The New Flows chart displays new TCP and UDP
flows for an application, a specific set of applications, or all applications for a
given period. A TCP flow is considered a new flow when it sees the first SYN packet.
A UDP flow is considered a new flow when it sees the first UDP packet in either
direction. A flow is a sequence of packets in both directions identified by the
source and destination IP, source and destination port, and the protocol.
The New Flows charts are used to:
- Analyze a site in terms of connections per second.
- Monitor any unlikely increase in the number of flows for a particular application, such as DNS or any critical application, which could be a sign of malicious activity.
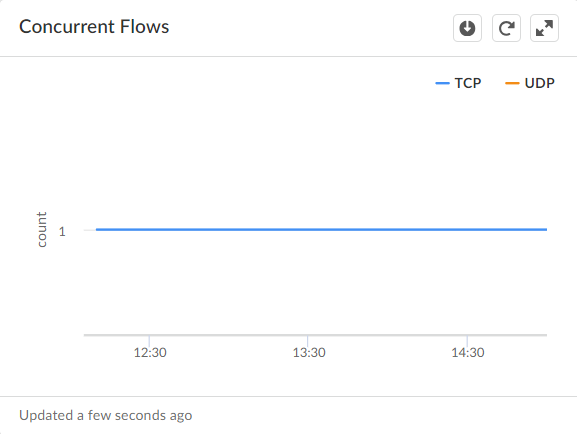
Concurrent Flows
The Concurrent Flow chart helps to understand how
many connections are active on your network by application. The chart provides a
granular view by TCP and UDP flows for an application, a specific set of
applications, or all applications. Concurrent flows are the currently active flows,
including all new flows and mature flows in the system.
The Concurrent Flows charts are used to:
- Analyze a site in terms of connections per second.
- Monitor any unlikely increase in the number of flows for a particular application, such as DNS or any critical application, which could be a sign of malicious activity.