Prisma SD-WAN
Configure the Zoom QSS CloudBlade in Prisma SD-WAN
Table of Contents
Expand All
|
Collapse All
Prisma SD-WAN Docs
-
-
- Prisma SD-WAN Controller
-
- CloudBlade Integrations
- CloudBlades Integration with Prisma Access
-
-
-
-
- 6.5
- 6.4
- 6.3
- 6.1
- 5.6
- Prisma SD-WAN Controller
- Prisma SD-WAN On-Premises Controller
- Prisma SD-WAN CloudBlades
- Prisma Access CloudBlade Cloud Managed
- Prisma Access CloudBlade Panorama Managed
Configure the Zoom QSS CloudBlade in Prisma SD-WAN
Learn to configure the Zoom QSS CloudBlade in Prisma SD-WAN, understand the
configuration parameters and learn about how to access the zoom application
experience.
| Where Can I Use This? | What Do I Need? |
|---|---|
|
|
To configure the Zoom QSS CloudBlade in Prisma SD-WAN:
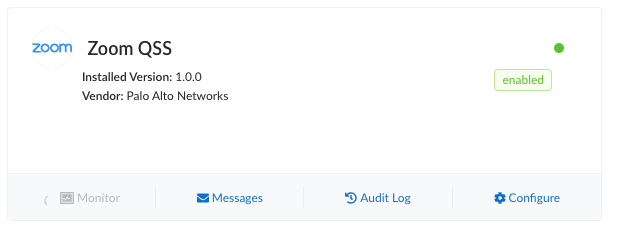
- From Strata Cloud Manager, go to ConfigurationPrisma SD-WAN CloudBlades.In CloudBlades, locate the Zoom QSS CloudBlade tile and select Configure.
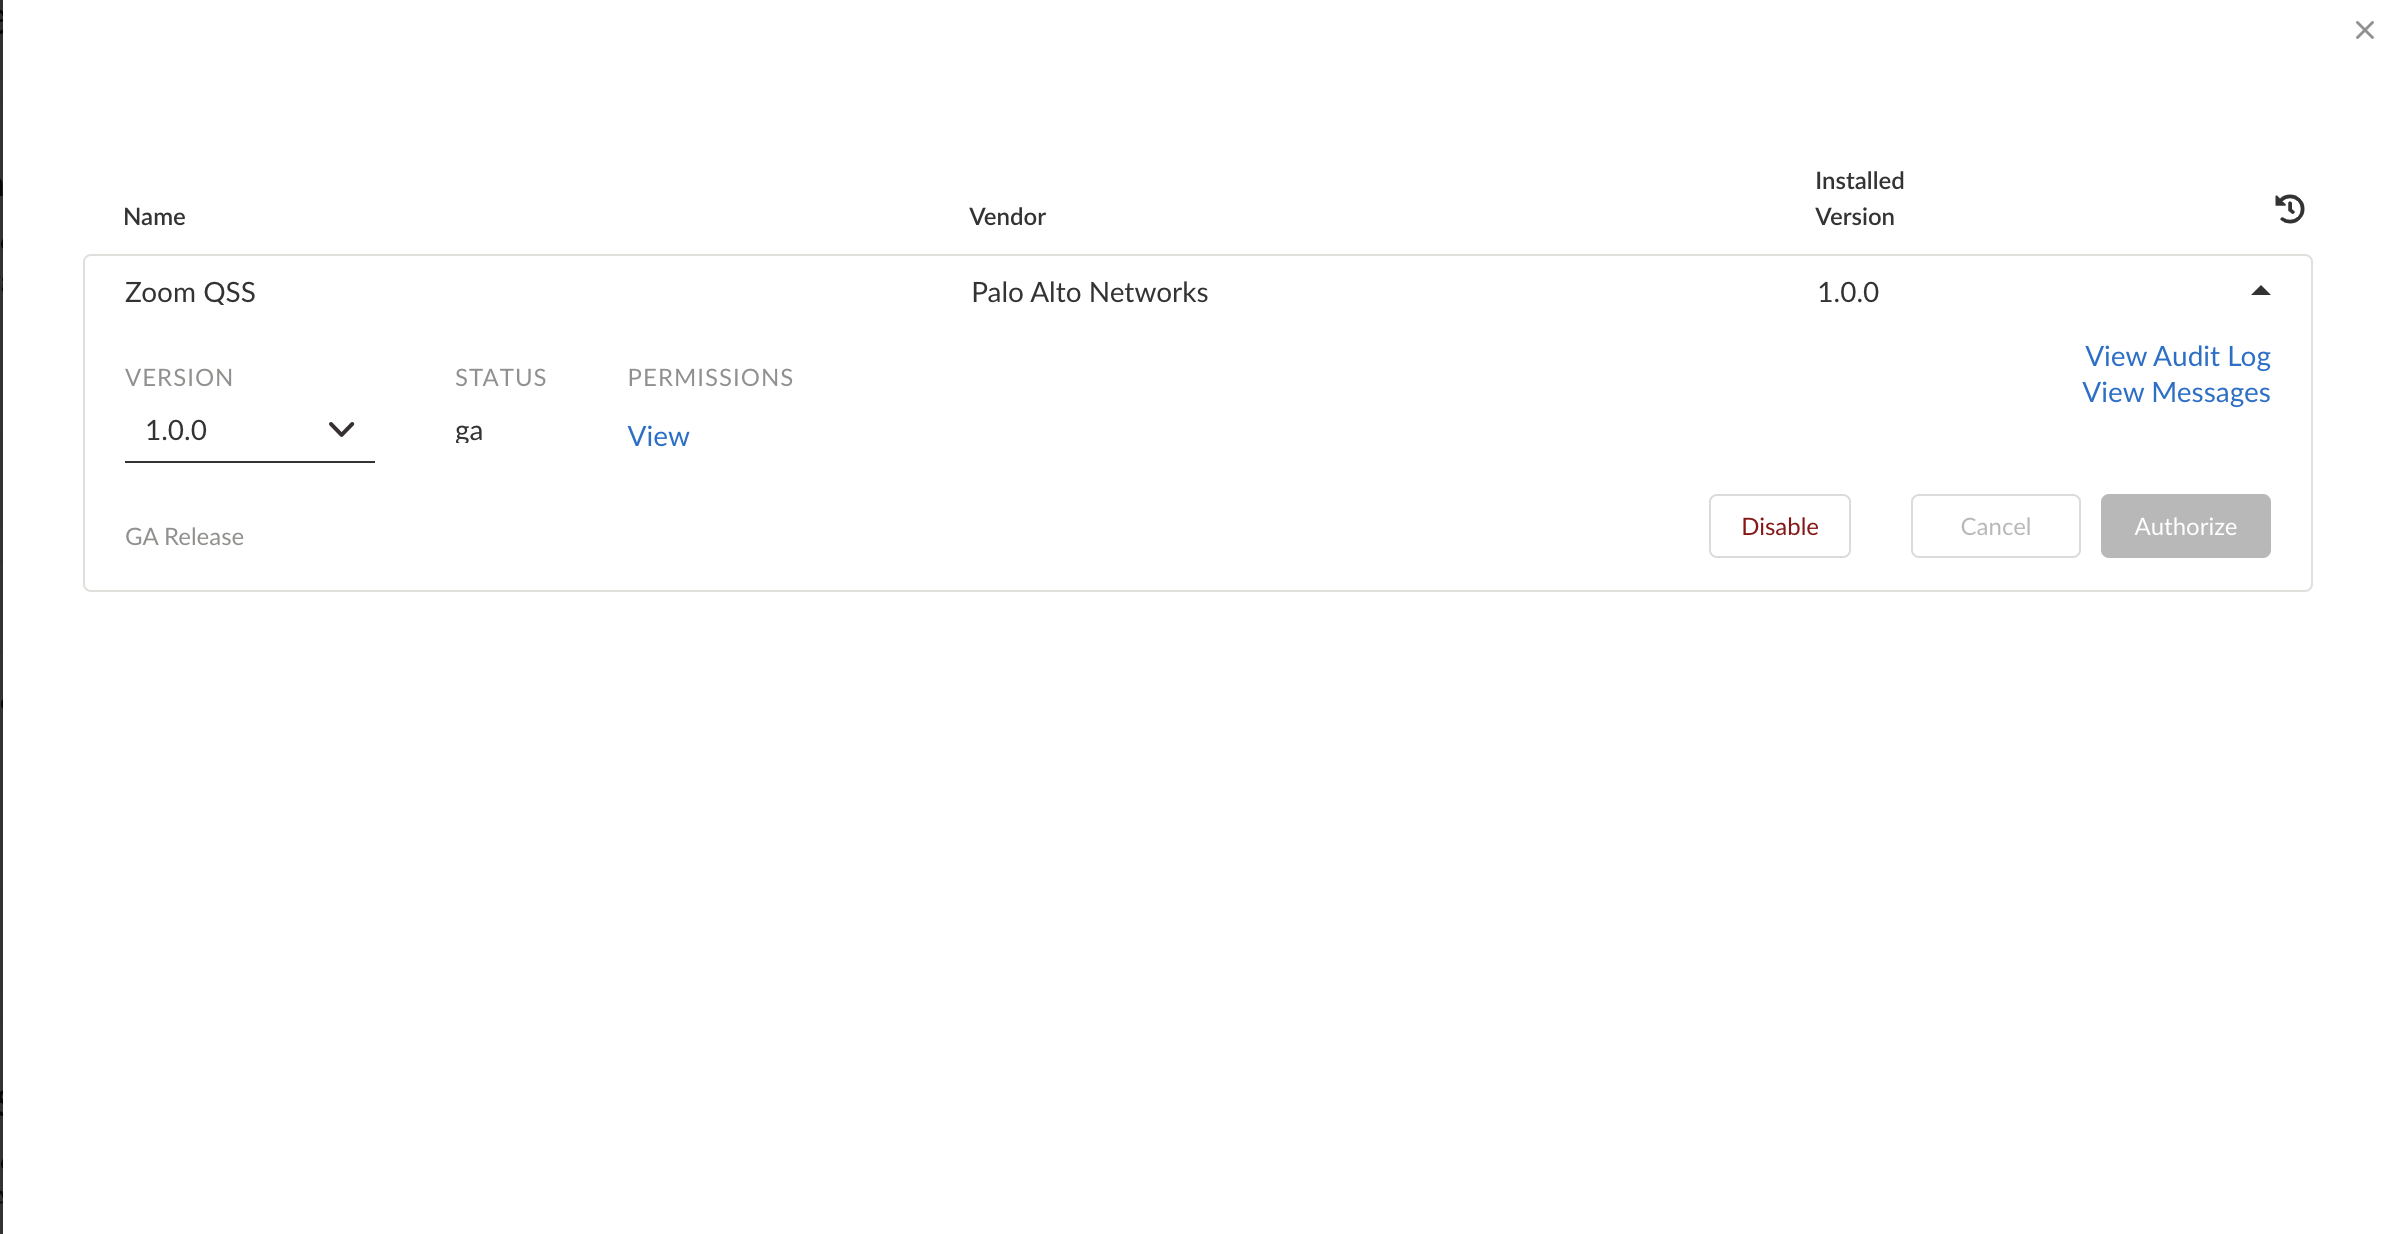
![]() Select Authorize.If the Zoom authorization is already done, the button on the configuration screen will be disabled.
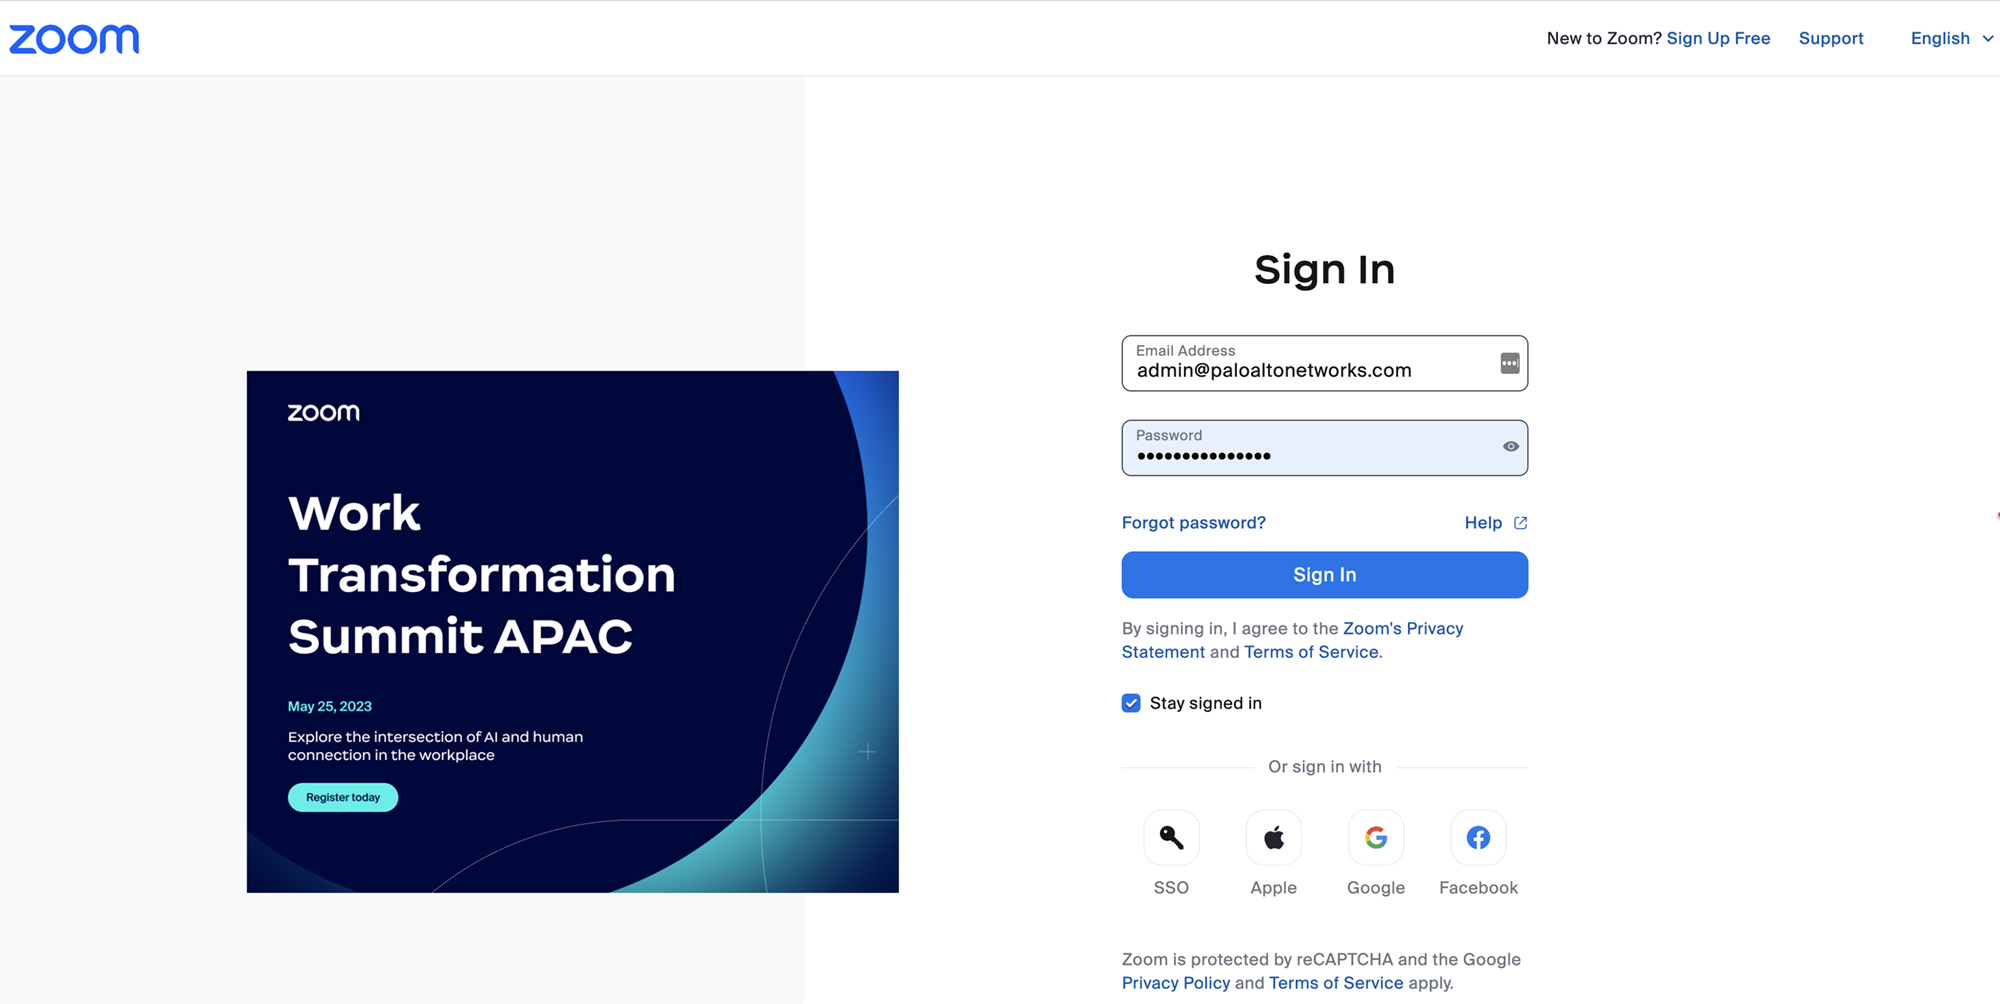
Select Authorize.If the Zoom authorization is already done, the button on the configuration screen will be disabled.![]() Enter your Zoom credentials (Email Address and Password) in the Zoom sign in page.
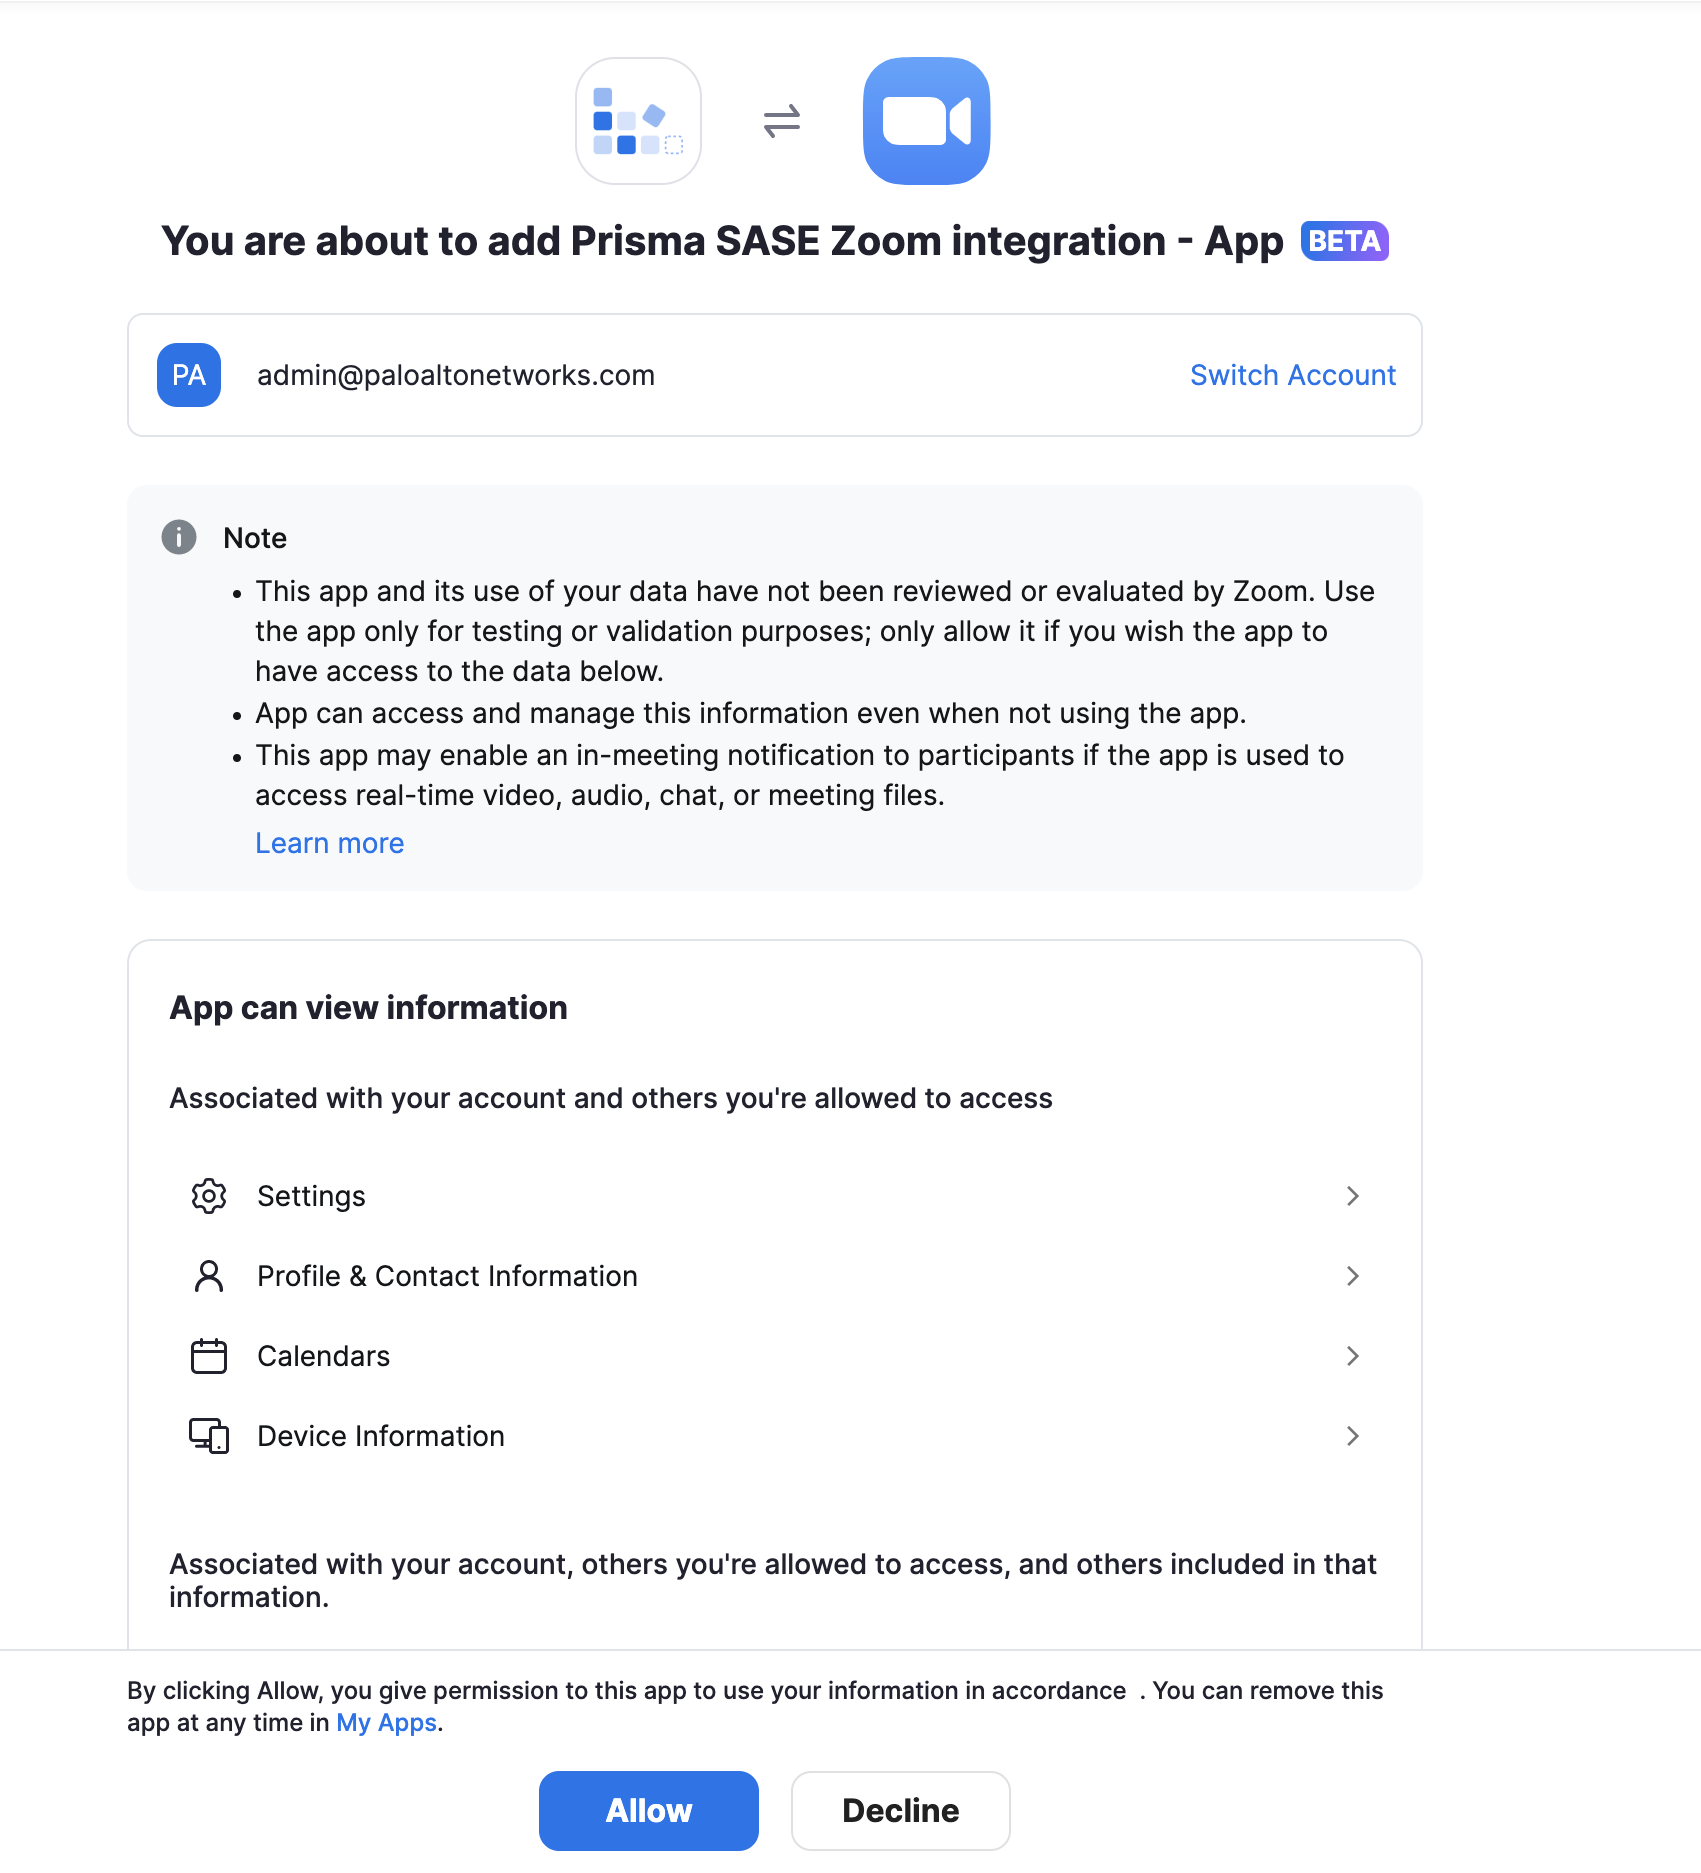
Enter your Zoom credentials (Email Address and Password) in the Zoom sign in page.![]() Select Allow to add access permissions of the Prisma SASE Zoom Integration app.
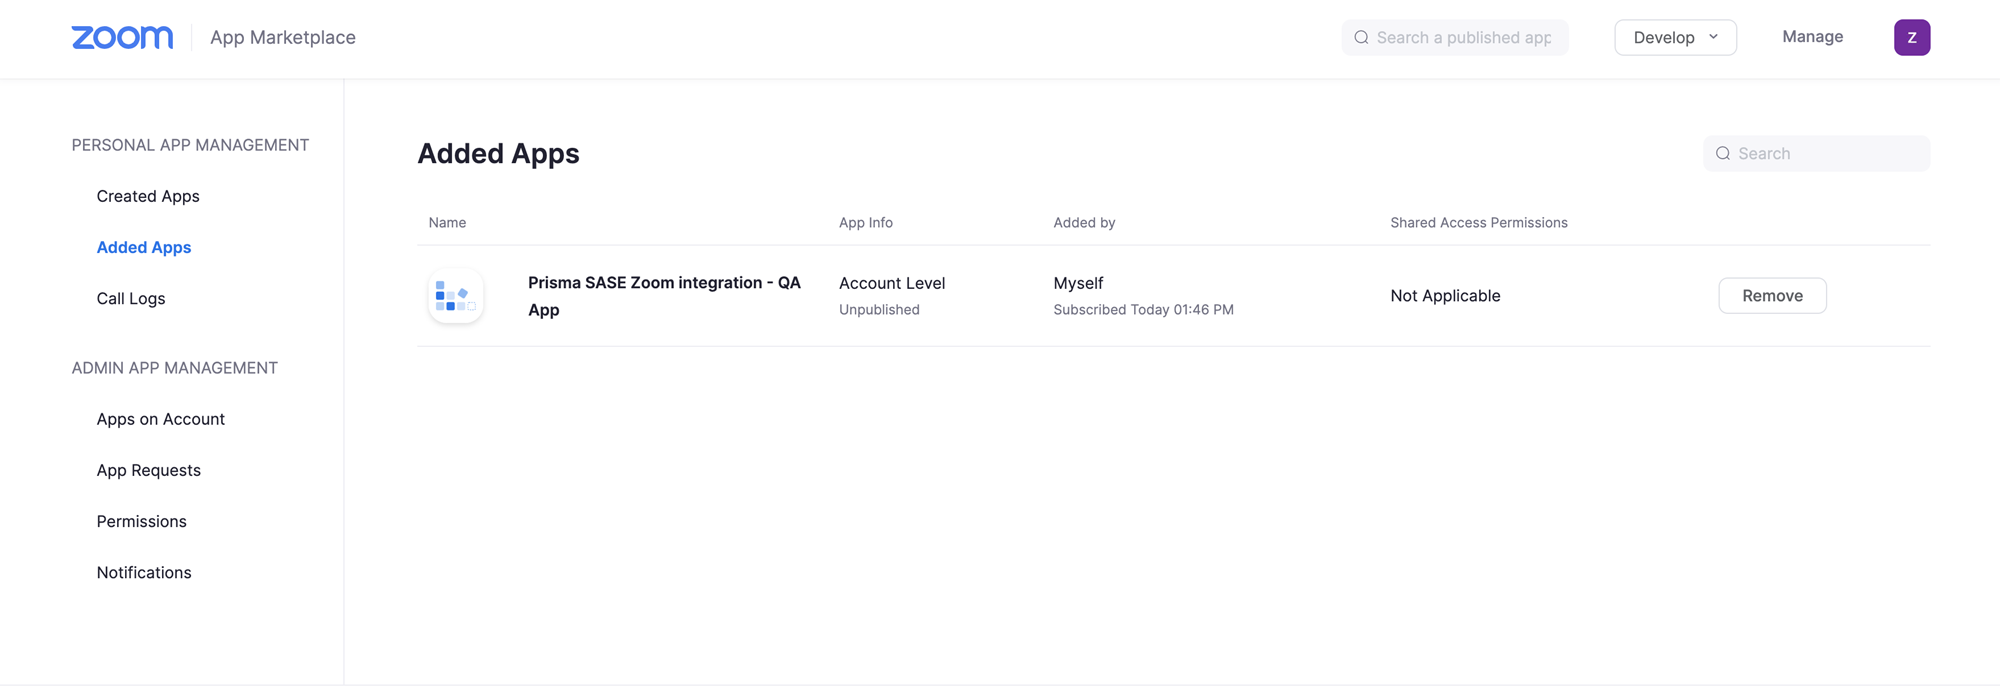
Select Allow to add access permissions of the Prisma SASE Zoom Integration app.![]() To verify if the CloudBlade is enabled, go to the Zoom marketplace to see if the Prisma SASE Zoom Integration app is published under Added Apps.
To verify if the CloudBlade is enabled, go to the Zoom marketplace to see if the Prisma SASE Zoom Integration app is published under Added Apps.![]() You will see a green indicator on the Zoom QSS CloudBlade tile upon successful authorization. A red indicator means the Zoom account is not authenticated properly, and needs to be re-authorized. When there is no indication, the CloudBlade is in a uninstalled state.
You will see a green indicator on the Zoom QSS CloudBlade tile upon successful authorization. A red indicator means the Zoom account is not authenticated properly, and needs to be re-authorized. When there is no indication, the CloudBlade is in a uninstalled state.![]()
Access Zoom Application Experience Data
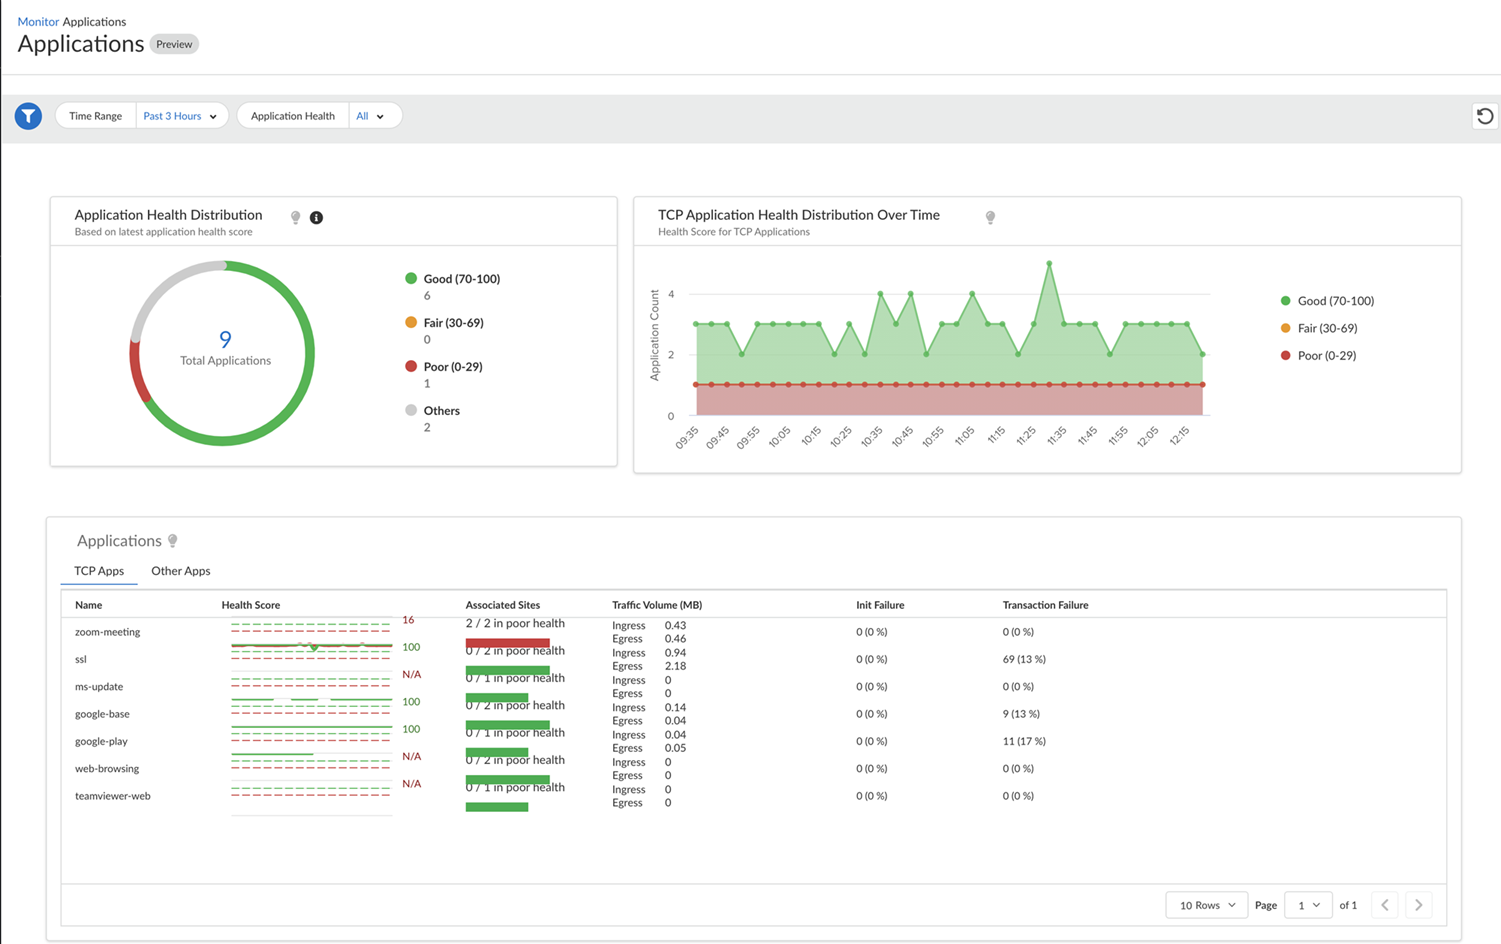
Prisma SD-WAN shows you the Zoom application experience data at an individual user level. You can navigate to this data from the following dashboards:- Go to Strata Cloud ManagerInsightsPrisma SD-WAN Applications.
![]() The Application screen shows you the following widgets:
The Application screen shows you the following widgets:- Application Health Distribution: The distribution of good, fair, and poor applications for a given tenant.
- TCP Application Health Distribution Over Time: The time series graph of application health distribution over time displays the good, fair, and poor applications for a given tenant. The time-series graph should be computed and refreshed based on the selected duration. For example, supported durations are 1 hour, 3 hours, one day, seven days, 30 days, and 90 days and the interval is 1 minute, 5 minutes, 1 hour, and one day, respectively.
- Applications: Lists all the applications details under TCP Apps such as Name, Health Score, Associated Sites, Traffic Volume, Init/Failure, and Transaction Failure.
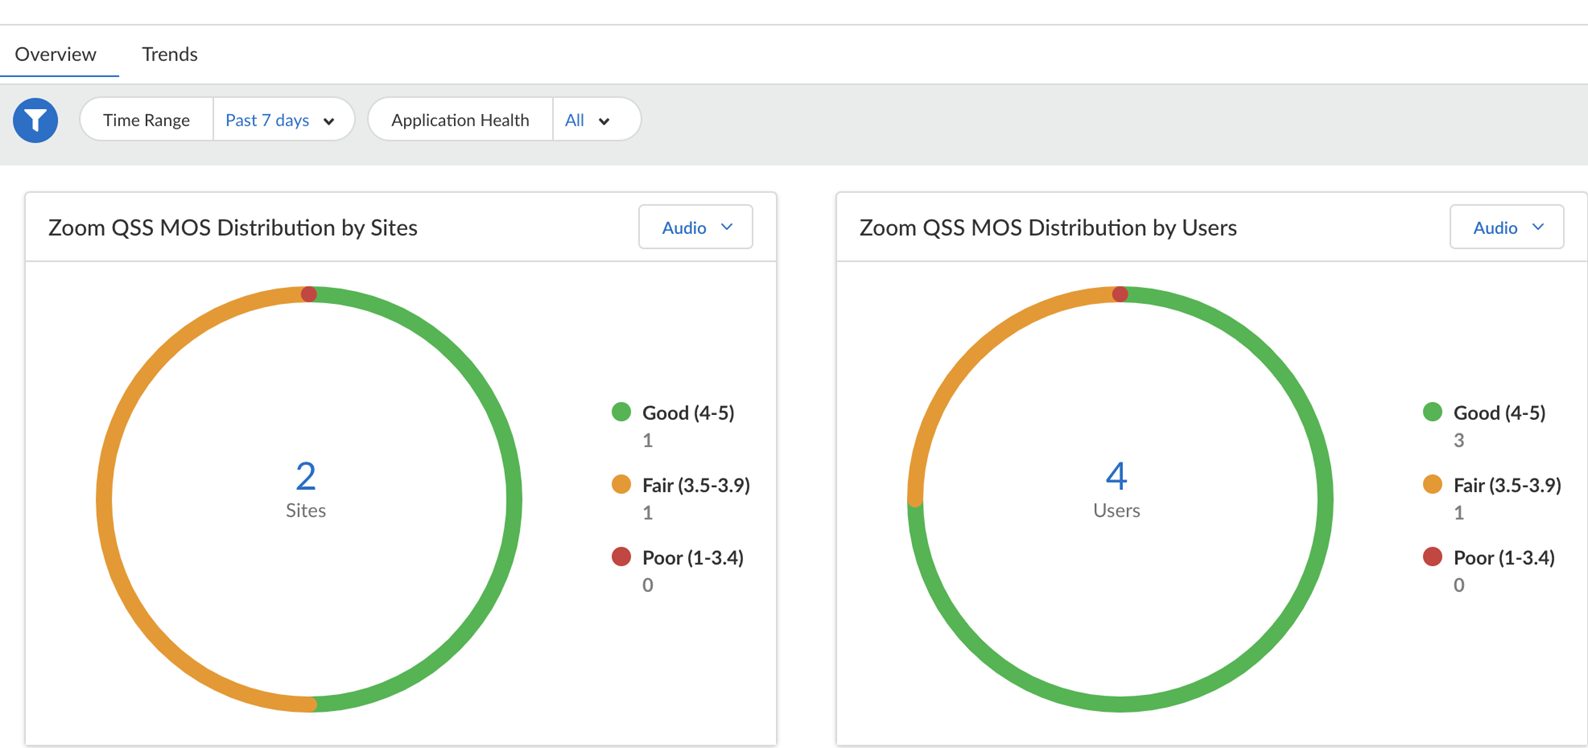
Select the zoom-meeting app from the list of apps. The Overview tab displays the Zoom QSS MOS distribution data for a site and for a user.![]()
- Zoom QSS MOS Distribution by Sites: shows the Zoom MOS distribution of good, fair, and poor applications across sites. This application data can be filtered by audio, video, and screen share for a selected time period.
- Zoom QSS MOS Distribution by Users: shows the Zoom MOS distribution of good, fair, and poor applications across users. This application data can be filtered by audio, video, and screen share for a selected time period.
- zoom-meeting Performance Details: shows the
zoom meeting performance and metrics per user for a selected time
period. The Users tab lists a user's client
IP address, user email, SD-WAN site, MOS count, latency, jitter, and
packet loss percentage.
![]()
Select the Trends tab to see the overall performance metrics against the network baseline app performance for audio, video, and screen share performance for a selected time frame.The following graphs represent:- Latency (Zoom): The latency used from the Zoom application in both the ingress and egress directions.
- Jitter (Zoom): The jitter used from the Zoom application in both the ingress and egress direction.
- Packet Loss (Zoom): The packet loss from the Zoom application in both the ingress and egress direction.
- Frame Rate (Zoom):The Frame rate (expressed in frames per second or FPS) at which consecutive images (frames) are captured or displayed from the Zoom application in both the ingress and egress directions.
- Resolution (Zoom): The resolution of the
images (frames) are captured or displayed from the Zoom application
across users in both the ingress and egress direction. The
resolution markers depicted are color coded.
![]()
If the Zoom metrics is not visible for a period of time, recheck the QSS license status and reconfirm if the Zoom QSS CloudBlade is authorized successfully. If the issue still persists, contact the Palo Alto Networks support team.

