Prisma SD-WAN
Prisma SD-WAN Predictive Analytics Dashboard
Table of Contents
Prisma SD-WAN Predictive Analytics Dashboard
Let us learn about the Predictive Analytics (AIOps) Dashboard for Prisma
SD-WAN.
| Where Can I Use This? | What Do I Need? |
|---|---|
|
|
Prisma SD-WAN Predictive Analytics provides deep observability into the
health of sites and applications and proactive monitoring to identify critical issues
and troubleshoot them faster, thus enhancing service levels.
- Select to view the Predictive Analytics dashboard. Observability identifies critical Sites, Links, and Applications and categorizes them as Good, Fair, and Poor at the tenant level, based on AI/ML health scores.
- Prediction includes predicting capacity utilization at the site level based on the previous three to six months of information.
- The default time range to view the metrics is three hours; however, you can adjust it to shorter or longer periods depending on the desired scope of information.
- Gain insights into the top 10 sites whose bandwidth utilization increased in the previous 28 days ; it will show seven days prediction whenever 28 days prediction is unavailable and predict the future branch capacity utilization.
- For time ranges longer than seven days, a Network DVR license is required. For more information, contact your Palo Alto Networks Account Team.
Observability and Prediction are available to you with an active WAN Clarity.
Predictive Analytics in the preview mode is available only to select customers
(migrated to the new data lake infrastructure) and will be made available to other
customers in the future. For more information, contact the Palo Alto Networks
Accounts Team.
Sites
The active branch sites are categorized as Good,
Fair, and Poor, and inactive sites
are classified as N/A.
The Sites widget displays the sites that are doing poorly
across the tenant. For example, a site is considered poor when greater than 10% of
the site health score samples are poor. Let us say in a three hour duration, there
can be 36 samples (5-minute intervals equate to 12 samples in one hour and 36
samples in three hours) of site health score. If three samples scored less than 30,
the site is counted as poor. Poor site count is derived based on the number of
unique sites that are poor for any interval of the entire duration.
| Rating | Score Range | Comments |
|---|---|---|
| Good | >=70 | 90% or more samples having health score greater than or equal to 70 for the selected duration. |
| Fair | 30-69 | Samples having score between 30 - 69. |
| Poor | <30 | 10% or more samples have health score less than 30 for the selected duration. |
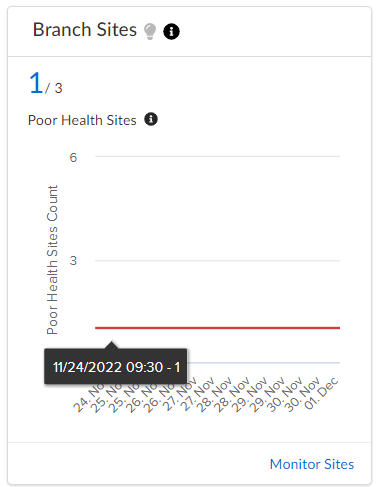
Click Monitor Sites to view Sites.
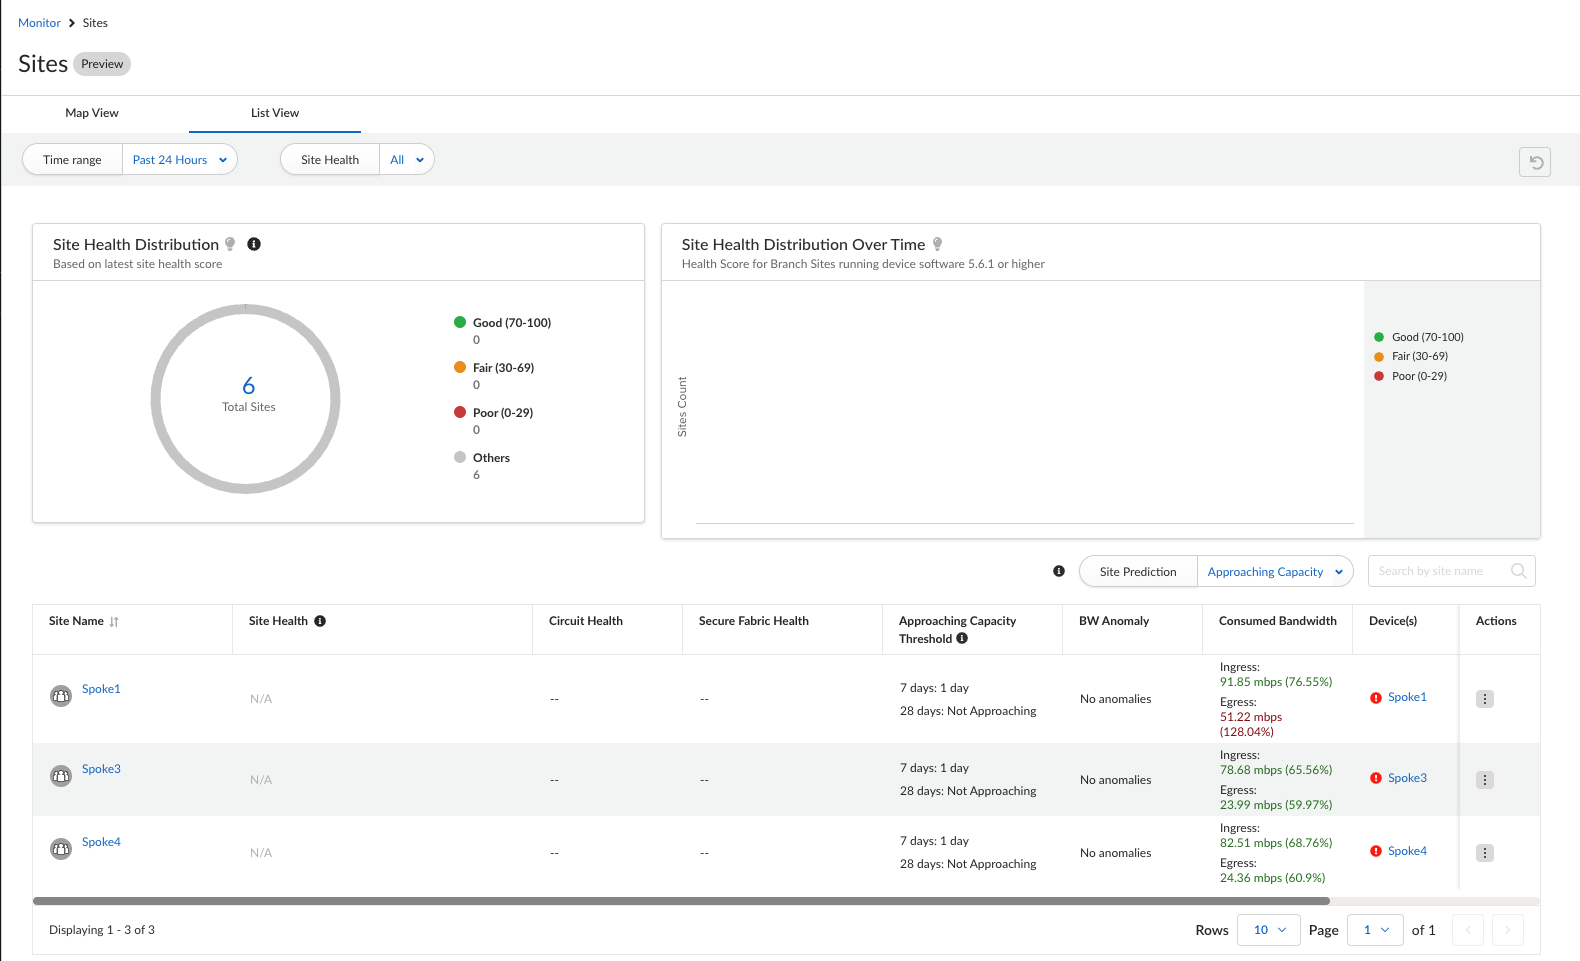
Alternatively, select to view Sites. This widget shows you how many
sites were active during the Time Range selected. A poor site's average score is the
average of all the poor samples of sites identified as poor.
- Site Health Distribution—The distribution of Good, Fair, and Poor sites graph for a given tenant.
- Site Health Distribution Over Time—The Time series graph of Site Health Distribution Over Time for a given tenant.The time-series graph is computed and refreshed based on the selected duration. For example, supported durations are one hour, three hours, 24 hours, seven days, 30 days, and 90 days and the interval is one minute, five minutes, one hour, and one day, respectively.
Applications
The Applications widget displays the identified health score
of all poor applications and lists poor applications for a tenant based on the
health score, and plots the average health score of poor applications for the last
three hours in five minutes interval.
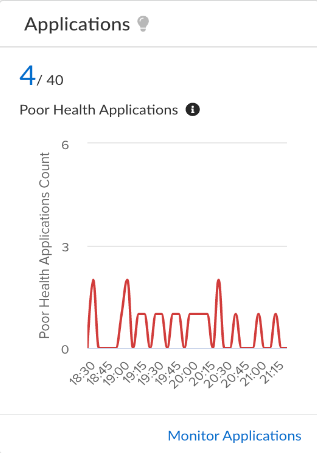
Click Monitor Applications to view the Applications detail widget.
This widget shows the list of Applications, Health Score numbers, and other details
related to that particular application.
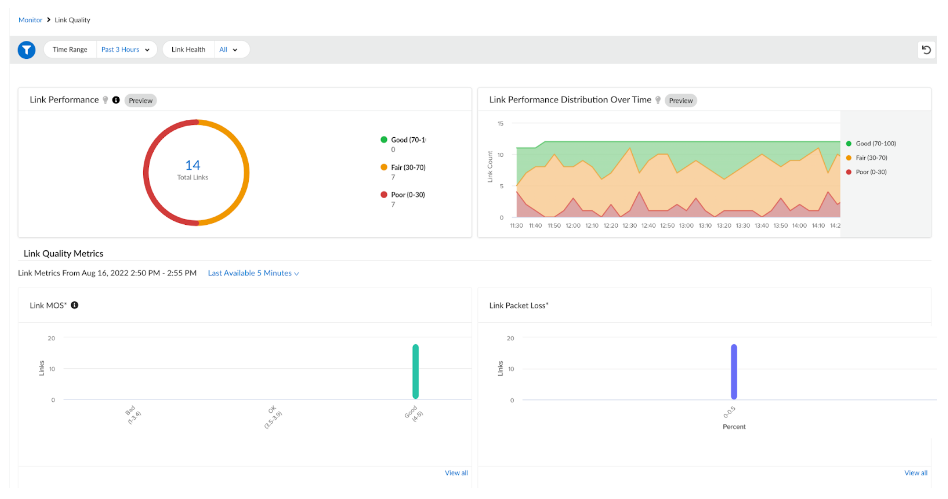
Links
The Links widget displays the identified count of poor links
for a tenant based on the health score for the given period.
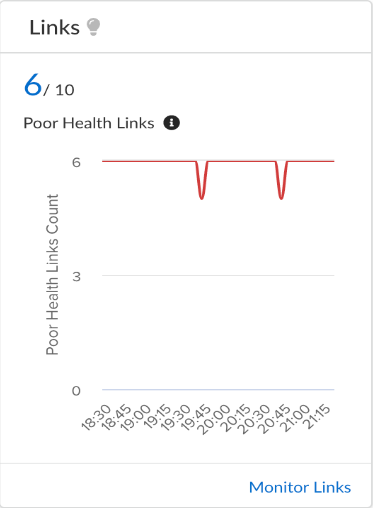
Click Monitor Links to view the Link Quality
screen. The links list view captures:
- Link Performance—The distribution of Good, Fair, and Poor links graph for a given tenant.
- Link Performance Distribution Over Time—The Time series graph of Link Performance Distribution Over Time for a given tenant.The time-series graph is computed and refreshed based on the selected duration. For example, supported durations are one hour, three hours, 24 hours, seven days, 30 days, and 90 days and the interval is one minute, five minutes, one hour, and one day, respectively.
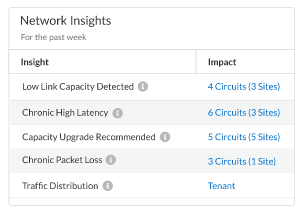
Network Insights
Insights are determined by the system using a suite of machine learning
algorithms.
These insights identify conditions such as:
- Excessive Packet Loss Detected
- Excessive Latency Detected
- Bandwidth Upgrade Recommended
- Configured vs Consumed Bandwidth Mismatch Detected
- Low Circuit Throughput Detected
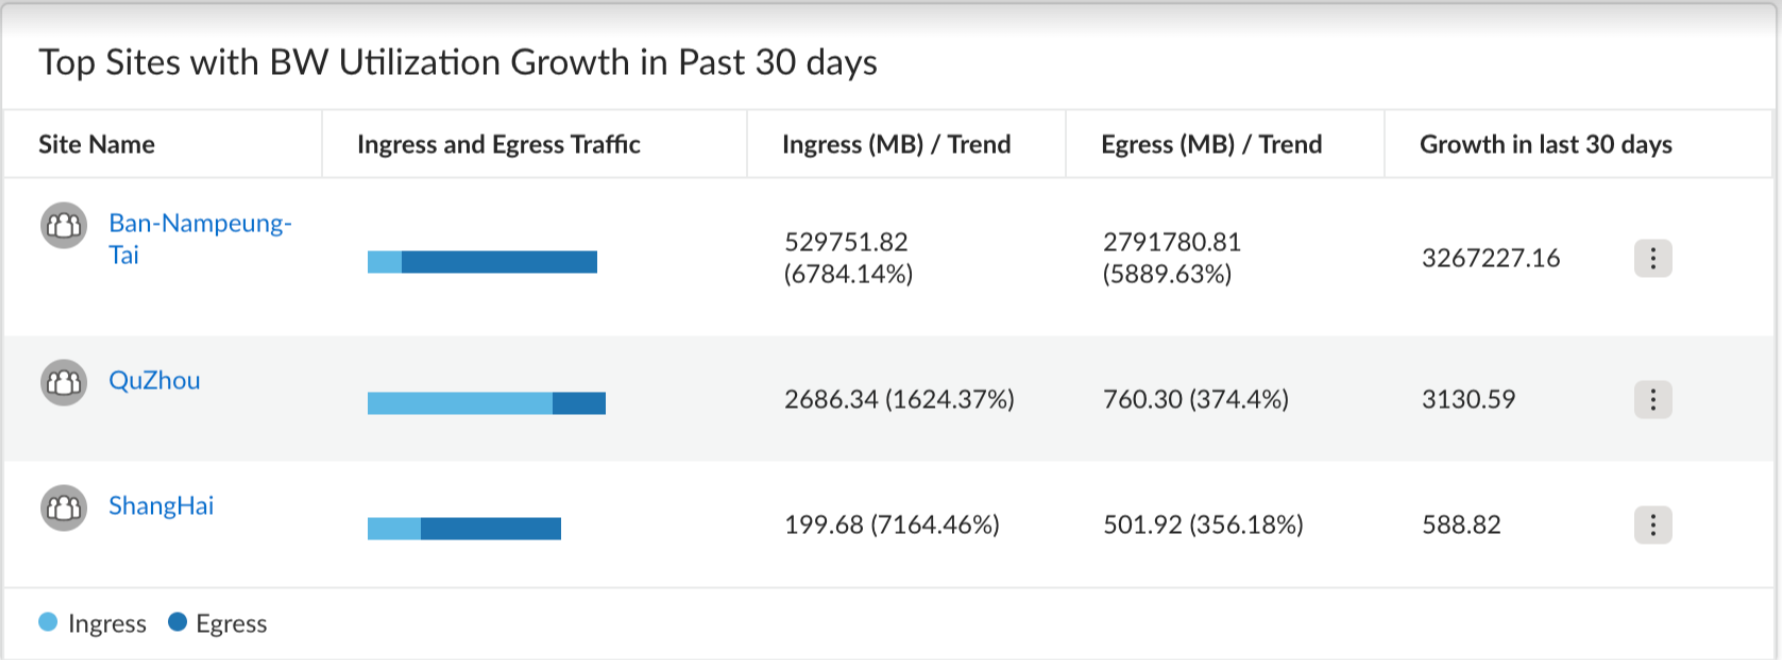
Top Sites with BW Utilization Growth in Past 30 days
The Top Sites with BW Utilization Growth in Past 30 days
widget displays the top 10 Sites that have only increased their utilization in the
last 30 days. Ingress and Egress Trend depicts information for the previous 30
days.
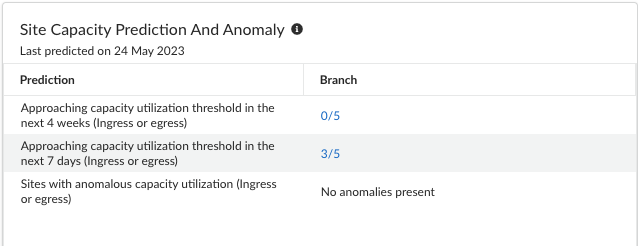
Site Capacity Prediction and Anomaly
The Site Capacity Prediction and
Anomaly widget displays the number of sites that will reach high
capacity utilization threshold within the next 28 days. If 28 days prediction is
unavailable, it will show the seven days prediction for the branch site capacity
utilization, the bandwidth anomaly for the specified time range filter, and the
bandwidth forecast for the next seven days.
Click the branch to view the sites that are attaining high capacity bandwidth
utilization.
Click on the number under the Branch column to view the Site List View screen. You
can see the sites that are approaching capacity listed in the table. For the
anomalous occurrence branch, you can further drill down into the site list
section to see the bandwidth anomaly occurrences for each site.
Alternatively, you can select either Approaching Capacity, Anomaly or All to view
the site results.