Generate Custom Reports
Table of Contents
Generate Custom Reports
You can configure custom reports that the
firewall generates immediately (on demand) or on schedule (each
night). To understand the selections available to create a purposeful
custom report, see Custom
Reports.
After the firewall
has generated a scheduled custom report, you risk invalidating the
past results of that report if you modify its configuration to change its
future output. If you need to modify a scheduled report configuration,
the best practice is to create a new report.
- Select .Click Add and then enter a Name for the report.To base a report on an predefined template, click Load Template and choose the template. You can then edit the template and save it as a custom report.Select the Database to use for the report.Each time you create a custom report, a log view report is automatically created. This report show the logs that were used to build the custom report. The log view report uses the same name as the custom report, but appends the phrase (Log View) to the report name.When creating a report group, you can include the log view report with the custom report. For more information, see Manage Report Groups.Select the Scheduled check box to run the report each night. The report is then available for viewing in the Reports column on the side.To generate a scheduled custom report using logs stored in Cortex Data Lake on the Panorama™ management server, Cloud Service plugin 1.8 or later release must be installed on Panorama.Define the filtering criteria. Select the Time Frame, the Sort By order, Group By preference, and select the columns that must display in the report.(Optional) Select the Query Builder attributes if you want to further refine the selection criteria. To build a report query, specify the following and click Add. Repeat as needed to construct the full query.
- Connector—Choose the connector (and/or) to precede the expression you are adding.
- Negate—Select the check box to interpret the query as a negation. If, for example, you choose to match entries in the last 24 hours and/or are originating from the untrust zone, the negate option causes a match on entries that are not in the past 24 hours and/or are not from the untrust zone.
- Attribute—Choose a data element. The available options depend on the choice of database.
- Operator—Choose the criterion to determine whether the attribute applies (such as =). The available options depend on the choice of database.
- Value—Specify the attribute value to match.
For example, the following figure (based on the Traffic Log database) shows a query that matches if the Traffic log entry was received in the past 24 hours and is from the untrust zone.![]() To test the report settings, select Run Now. Modify the settings as required to change the information that is displayed in the report.Click OK to save the custom report.Examples of Custom ReportsIf you want to set up a simple report in which you use the traffic summary database from the last 30 days, and sort the data by the top 10 sessions and these sessions are grouped into 5 groups by day of the week. You would set up the custom report to look like this:
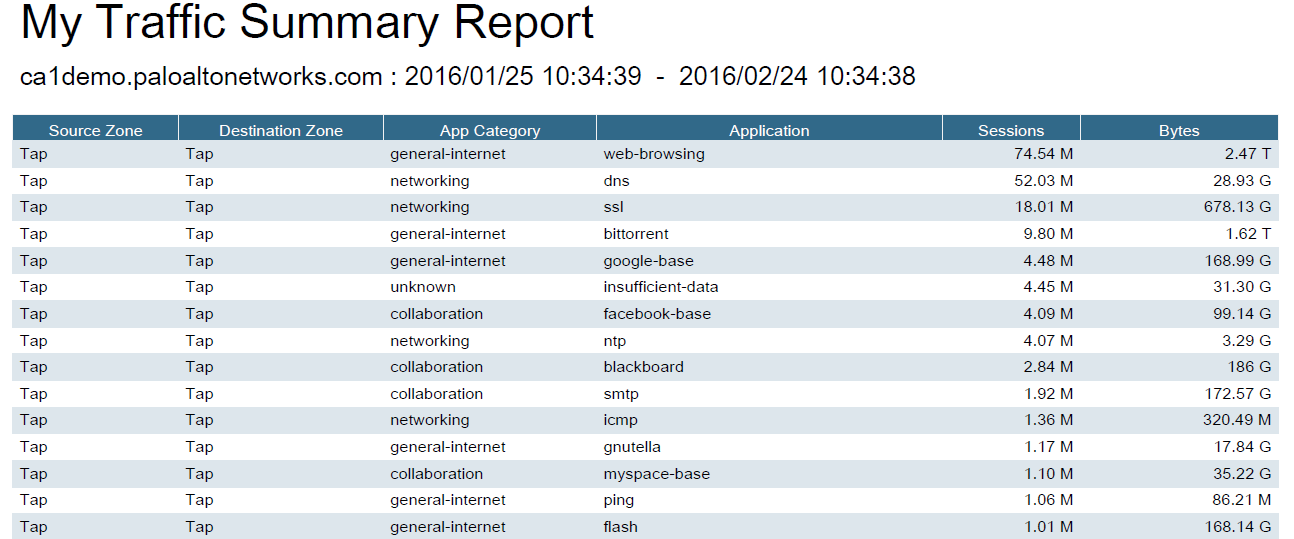
To test the report settings, select Run Now. Modify the settings as required to change the information that is displayed in the report.Click OK to save the custom report.Examples of Custom ReportsIf you want to set up a simple report in which you use the traffic summary database from the last 30 days, and sort the data by the top 10 sessions and these sessions are grouped into 5 groups by day of the week. You would set up the custom report to look like this:![]() And the PDF output for the report would look as follows:
And the PDF output for the report would look as follows:![]() Now, if you want to use the query builder to generate a custom report that represents the top consumers of network resources within a user group, you would set up the report to look like this:
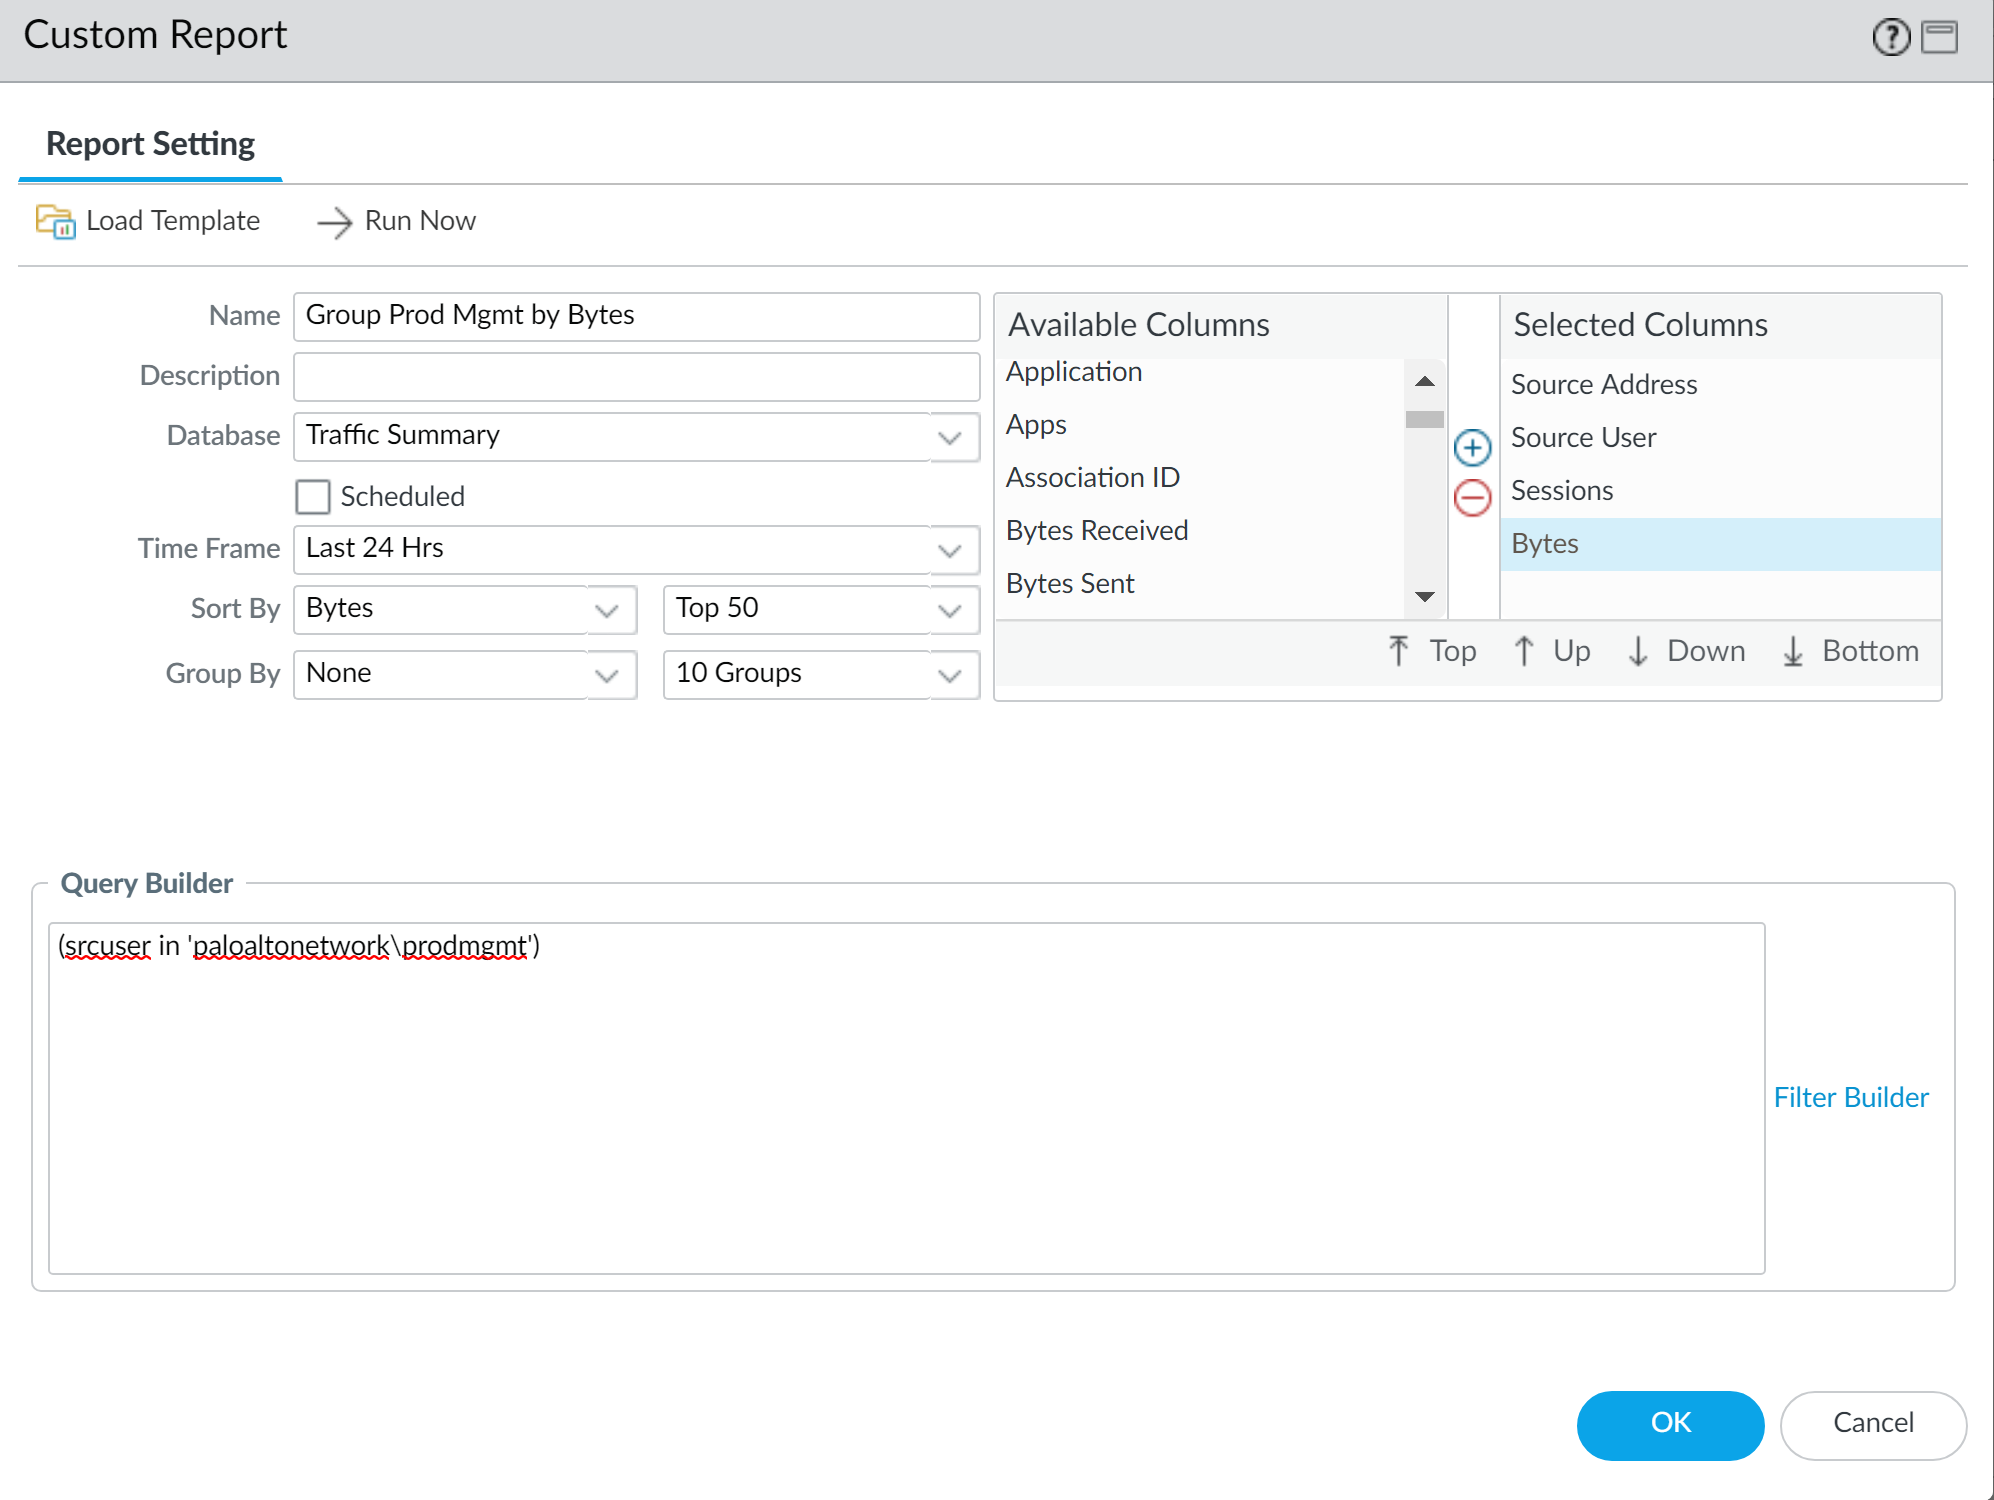
Now, if you want to use the query builder to generate a custom report that represents the top consumers of network resources within a user group, you would set up the report to look like this:![]() The report would display the top users in the product management user group sorted by bytes.
The report would display the top users in the product management user group sorted by bytes.