Identify Sessions That Use Too Much of the On-Chip Packet Descriptor
Table of Contents
Identify Sessions That Use Too Much of the On-Chip Packet Descriptor
When a firewall exhibits signs of resource
depletion, it might be experiencing an attack that is sending an
overwhelming number of packets. In such events, the firewall starts
buffering inbound packets. You can quickly identify the sessions
that are using an excessive percentage of the on-chip packet descriptor
and mitigate their impact by discarding them.
Perform the
following task on any hardware-based firewall model (not a VM-Series
firewall) to identify, for each slot and dataplane, the on-chip
packet descriptor percentage used, the top five sessions using more
than two percent of the on-chip packet descriptor, and the source
IP addresses associated with those sessions. Having that information
allows you to take appropriate action.
- View firewall resource usage, top sessions, and session details. Execute the following operational command in the CLI (sample output from the command follows):
admin@PA-7050> show running resource-monitor ingress-backlogs
-- SLOT:s1, DP:dp1 -- USAGE - ATOMIC: 92%  TOTAL: 93%
TOP SESSIONS:SESS-ID      PCT   GRP-ID   COUNT
6            92%   1        156                   7        1732
SESSION DETAILS SESS-ID PROTO SZONESRC       SPORT  DST       DPORT  IGR-IF    EGR-IF       APP
6    6     trust 192.168.2.35 55653  10.1.8.89 80  ethernet1/21 ethernet1/22 undecided
The command displays a maximum of the top five sessions that each use 2% or more of the on-chip packet descriptor.The sample output above indicates that Session 6 is using 92% of the on-chip packet descriptor with TCP packets (protocol 6) coming from source IP address 192.168.2.35.- SESS-ID—Indicates the global session ID that is used in all other show session commands. The global session ID is unique within the firewall.
- GRP-ID—Indicates an internal stage of processing packets.
- COUNT—Indicates how many packets are in that GRP-ID for that session.
- APP—Indicates the App-ID extracted from the Session information, which can help you determine whether the traffic is legitimate. For example, if packets use a common TCP or UDP port but the CLI output indicates an APP of undecided, the packets are possibly attack traffic. The APP is undecided when Application IP Decoders cannot get enough information to determine the application. An APP of unknown indicates that Application IP Decoders cannot determine the application; a session of unknown APP that uses a high percentage of the on-chip packet descriptor is also suspicious.
To restrict the display output:On a PA-7000 Series model only, you can limit output to a slot, a dataplane, or both. For example:admin@PA-7050> show running resource-monitor ingress-backlogs slot s1 admin@PA-7050> show running resource-monitor ingress-backlogs slot s1 dp dp1
On PA-5200 Series and PA-7000 Series models only, you can limit output to a dataplane. For example:admin@PA-5260> show running resource-monitor ingress-backlogs dp dp1Use the command output to determine whether the source at the source IP address using a high percentage of the on-chip packet descriptor is sending legitimate or attack traffic.In the sample output above, a single-session attack is likely occurring. A single session (Session ID 6) is using 92% of the on-chip packet descriptor for Slot 1, DP 1, and the application at that point is undecided.- If you determine a single user is sending an attack and the traffic is not offloaded, you can End a Single Session DoS Attack. At a minimum, you can Configure DoS Protection Against Flooding of New Sessions.
- On a hardware model that has a field-programmable gate array (FPGA), the firewall offloads traffic to the FPGA when possible to increase performance. If the traffic is offloaded to hardware, clearing the session does not help because then it is the software that must handle the barrage of packets. You should instead Discard a Session Without a Commit.
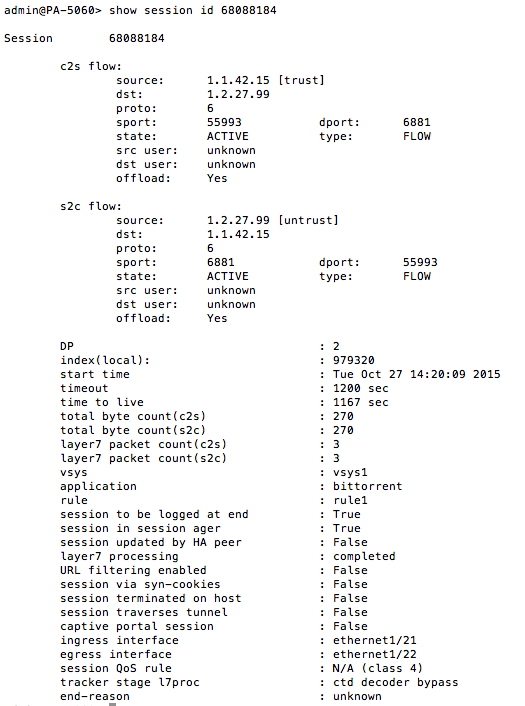
To see whether a session is offloaded or not, use the show session id <session-id> operational command in the CLI as shown in the following example. The layer7processing value indicates completed for sessions offloaded or enabled for sessions not offloaded.![]() If the show session id <session-id> command output shows information similar to the following, the output implies that the session has not yet been installed on the PAN-OS firewall. One reason why this can occur is because the traffic is denied due to a configured Security policy rule.> show session id xxxxxxxxxxSession xxxxxxxxxxBad Key: c2s: ‘c2s’Bad Key: s2c: ‘s2c’index(local): : yyyyyyy
If the show session id <session-id> command output shows information similar to the following, the output implies that the session has not yet been installed on the PAN-OS firewall. One reason why this can occur is because the traffic is denied due to a configured Security policy rule.> show session id xxxxxxxxxxSession xxxxxxxxxxBad Key: c2s: ‘c2s’Bad Key: s2c: ‘s2c’index(local): : yyyyyyy