NGFW Cluster Summary and Monitoring
Table of Contents
NGFW Cluster Summary and Monitoring
View information about an NGFW cluster and its health.
| Where Can I Use This? | What Do I Need? |
|---|---|
|
One of the following:
|
After you Configure an NGFW Cluster, you can view the summary and monitoring information about the
cluster.
The CN-Series and PA-Series cluster plugin visibility data is
not in real time; it's delayed by five minutes.
The prerequisites for cluster summary and monitoring are:
- You must from the list (enabled by default). For more information, see Configure an Admin Role Profile.
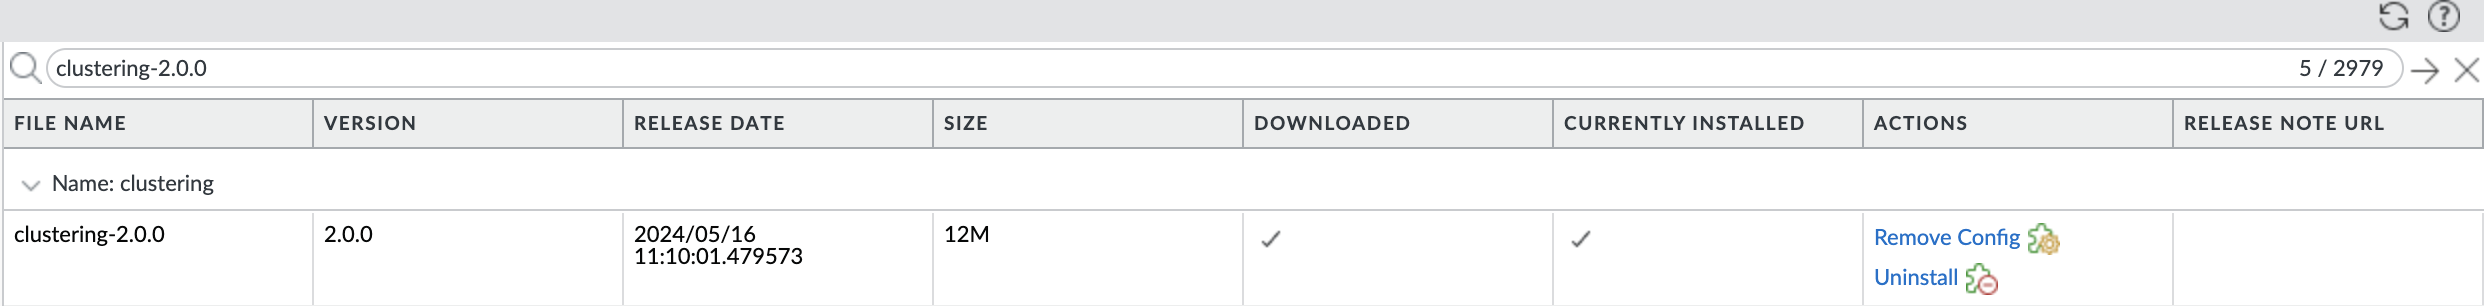
- You must install the Panorama Clustering Plugin (a version that is compatible with the Panorama version you're running) from . Scroll to clustering plugin.
Summary View
View the cluster summary under . In the Clusters field, select
PA-Series (or All Clusters).
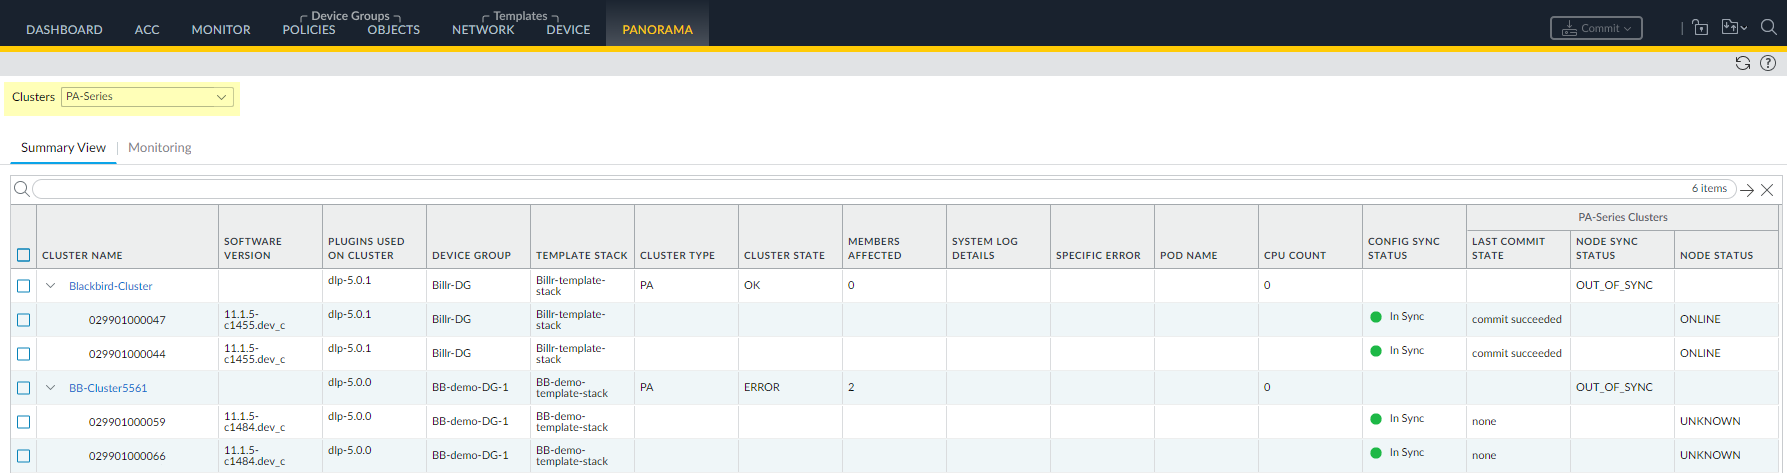
| Field | Description |
|---|---|
| Cluster Name | Name of the firewall cluster. |
| Software Version | PAN-OS version. |
| Plugins Used on Cluster | List of plugins used on the cluster. |
| Device Group | Name of the device group associated with the cluster. |
| Template Stack | Name of the template stack associated with the cluster. |
| Cluster Type | Type of cluster, such as PA or CN. |
| Cluster State | Displays the health of the cluster, which is derived from node
status of all nodes in the cluster. Cluster state will be:
|
| Members Affected | Number of impacted cluster members and their names. |
| System Log Details | Displays the details of the system events. |
| Specific Error | List of specific errors in the cluster. Click the link to view more details about the error under where you can view logs. |
| Pod Name | (CN-Series cluster only) Name of the pod. |
| CPU Count | Number of CPUs used. |
| Config Sync Status |
(PA-Series Clusters only) Config synchronization status
between Panorama and the firewalls in the PA cluster. Status can
be In Sync or Out of Sync. After you successfully add firewalls
to the cluster, commit, and push, the Config Sync Status
displays as In Sync.
|
| Last Commit State |
(PA-Series cluster only) State of the last attempted
commit (not the actual state of the cluster):
|
| Node Sync Status |
(PA-Series cluster only) Synchronization status of the
Node Flow Table:
|
| Node Status |
(PA-Series Clusters only) Possible status of a cluster
node:
|
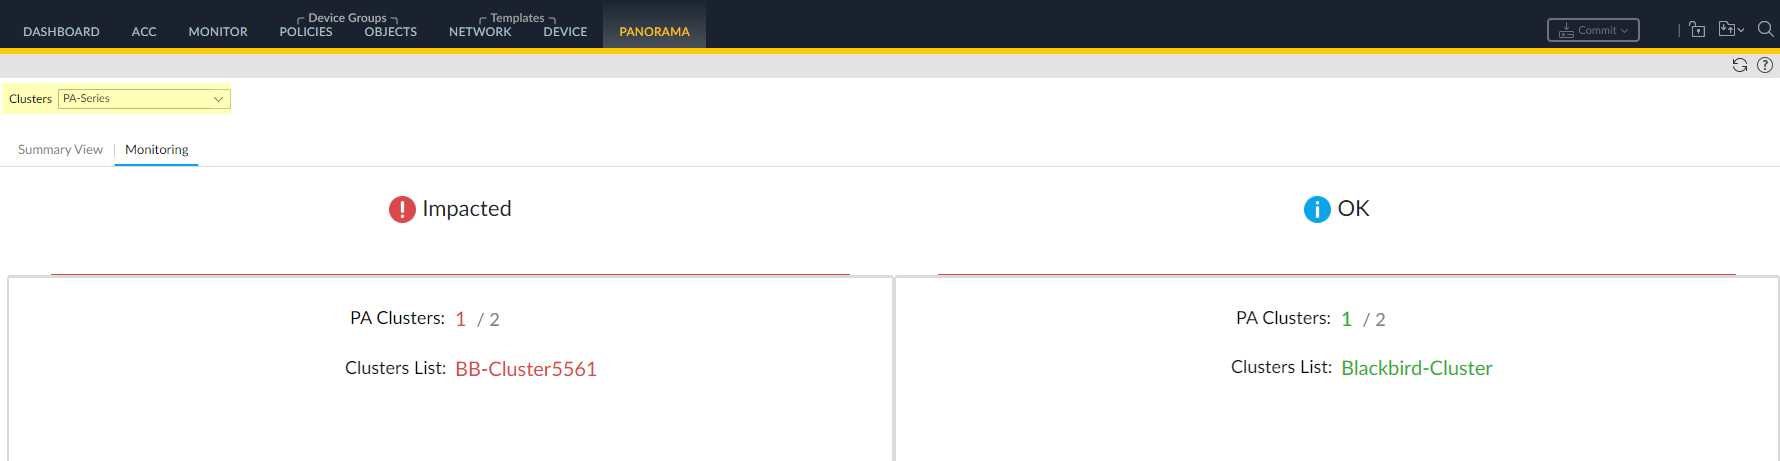
Monitoring
Monitor the health information of the PA-Series (NGFW) cluster under . In the Clusters field, select
PA-Series (or All Clusters).
The CN-Series and PA-Series cluster plugin visibility data
is not in real time; it's delayed by five minutes.
| Field | Description |
|---|---|
| Clusters | Select the Cluster type PA-Series. |
| Impacted | List of impacted clusters.
|
| OK | List of clusters that aren't impacted.
|
Click in the Monitoring window or select a cluster to view
Cluster Utilization.
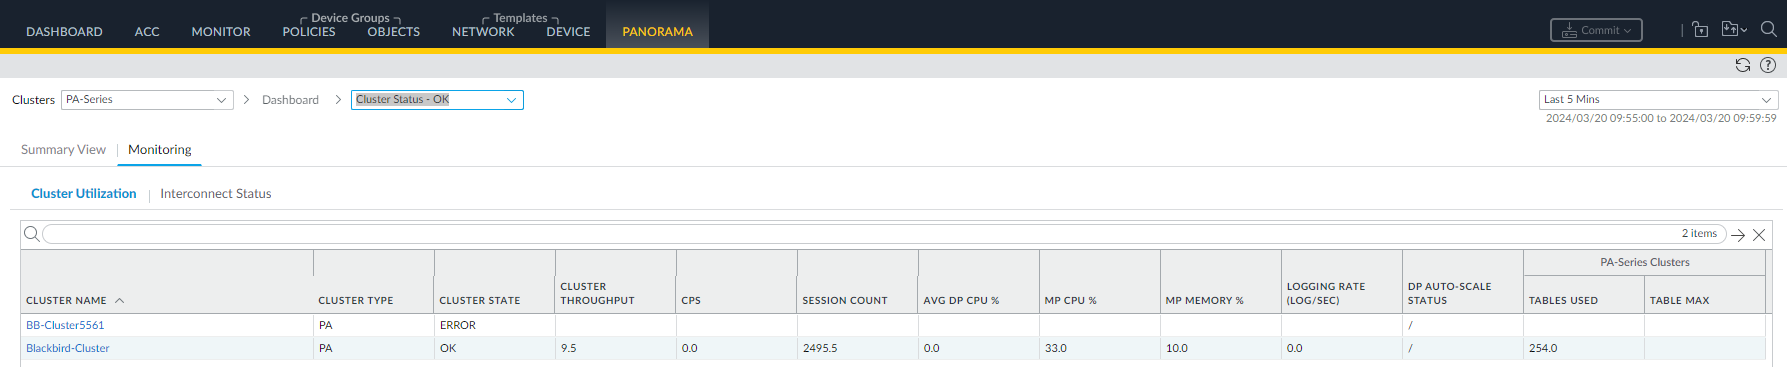
| Field | Description |
|---|---|
| Dashboard | Select to switch views between Cluster Status - OK and Cluster Status - Impacted. |
| Timeframe | Select timeframe of data displayed:
The CN-Series and PA-Series cluster
plugin visibility data is not in real time; it's delayed by five
minutes. |
| Cluster Name | Name of the firewall cluster. |
| Cluster Type | Type of cluster (CN or PA). |
| Cluster State | Displays the health of the cluster, which is derived from node
status of all nodes in the cluster. Cluster state will be:
|
| Cluster Throughput | Firewall cluster throughput in Gbps. |
| CPS | Number of connections per second. |
| Session Count | Number of sessions. |
| Avg DP CPU % | Average DP CPU utilization over the selected time period. |
| MP CPU % | Management plan CPU utilization in percentage. |
| MP Memory % | Management plan memory utilization in percentage. |
| Logging Rate (Log/Sec) | Rate at which the logs are being generated on the cluster. |
| DP Auto-Scale Status | Dataplane autoscale details. |
| Tables Used | (PA-Series cluster only) Entries in the node flow table that are in use. |
| Table Max | (PA-Series cluster only) Total possible number of entries in the node flow table. |
Click in the Monitoring window or select a cluster to view
Interconnect Status.
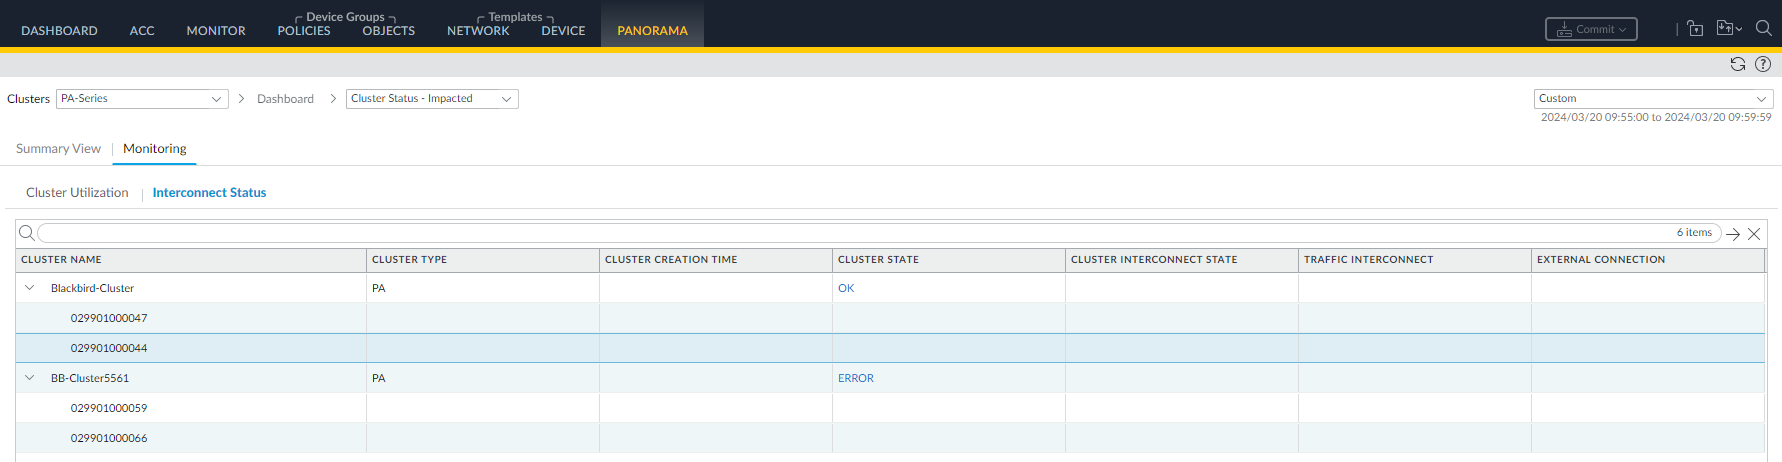
| Field | Description |
|---|---|
| Dashboard | Select to switch views between Cluster Status - OK and Cluster Status - Impacted. |
| Timeframe | Select timeframe of data displayed:
The CN-Series and PA-Series cluster
plugin visibility data is not in real time; it's delayed by five
minutes. |
| Cluster Name | Name of the firewall cluster. |
| Cluster Type | Type of cluster (CN or PA). |
| Cluster Creation Time | The time of cluster creation. |
| Cluster State | Displays the health of the cluster, which is derived from node
status of all nodes in the cluster. Cluster state will be:
Click the cluster state link to view more details about the
impacted cluster. |
| Cluster Interconnect State | Displays cluster interconnectivity.
|
| Traffic Interconnect | Status of traffic interconnectivity. |
| External Connection | Status of external connectivity. |
| Impacted Links | (CN-Series cluster only) Number of impacted links. |
| Management Connectivity | (CN-Series cluster only) Number of management connections. |
| Impacted Members | (CN-Series cluster only) List of impacted cluster members. |
| Time Stamp Uptime | (CN-Series cluster only) Uptime time stamp. |
| Time Stamp Downtime | (CN-Series cluster only) Downtime time stamp. |