Prisma Access
View and Monitor Dynamic Privilege Access Users
Table of Contents
View and Monitor Dynamic Privilege Access Users
View and monitor Dynamic Privilege Access user information in your
environment.
| Where Can I Use This? | What Do I Need? |
|---|---|
|
|
Dynamic Privilege Access enables Prisma Access to apply different network and Security
policy rules to mobile user flows based on the project your users are working on. Go to in the Strata Cloud Manager Command Center to view user-based access
information in your environment.
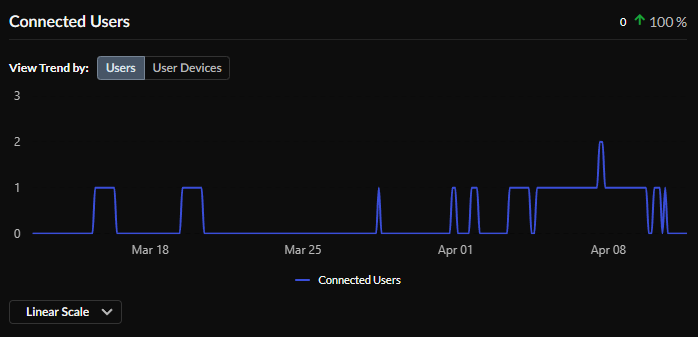
Connected Users
View Connected Users to view current connected users or
connected user devices. The up or down arrow compares this time range with a
previous time range to determine the difference, in percentage, in number of
connected users or devices.
Select View Trend by Users to view the number of users
currently connected to Prisma Access Agent, and click View Trend by User
Devices to see the number of user devices currently connected to
Prisma Access Agent.
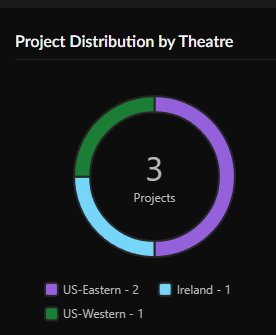
View Project Distribution by Theatre to see the number of
projects by location, or theater.
The Users | Devices table shows the Project Name
associated with each user and device. You can also see how many devices are
connected by user, last login time, last source location, last connected Prisma
Access location, the source Internet Protocol, and OS family and version.
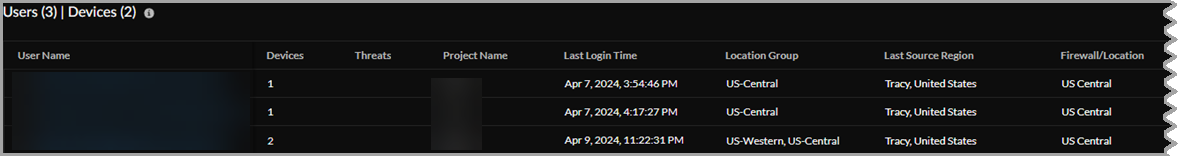
Select any Project Name to go to the
Projects page.
Select any User Name to view user details such as
Activity and Connectivity.
Activity
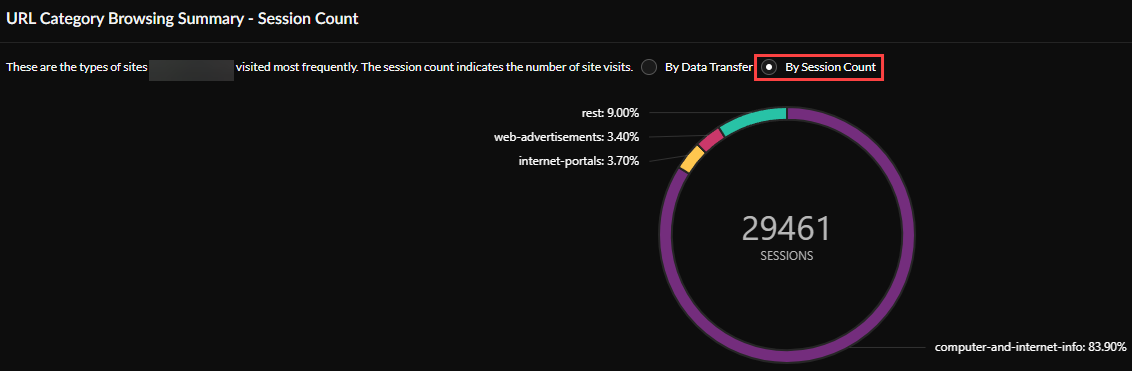
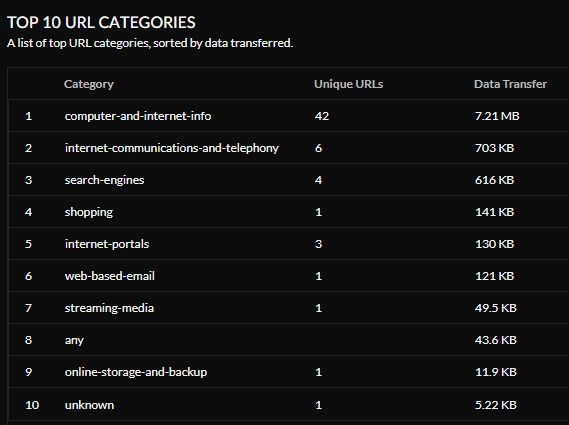
URL Browsing Category Summary- Data Transfer—View your
browsing category data transfer summary By Data Transfer
or By Session Count. You can also view a list of the
Top 10 URL Categories, sorted by data
transferred.
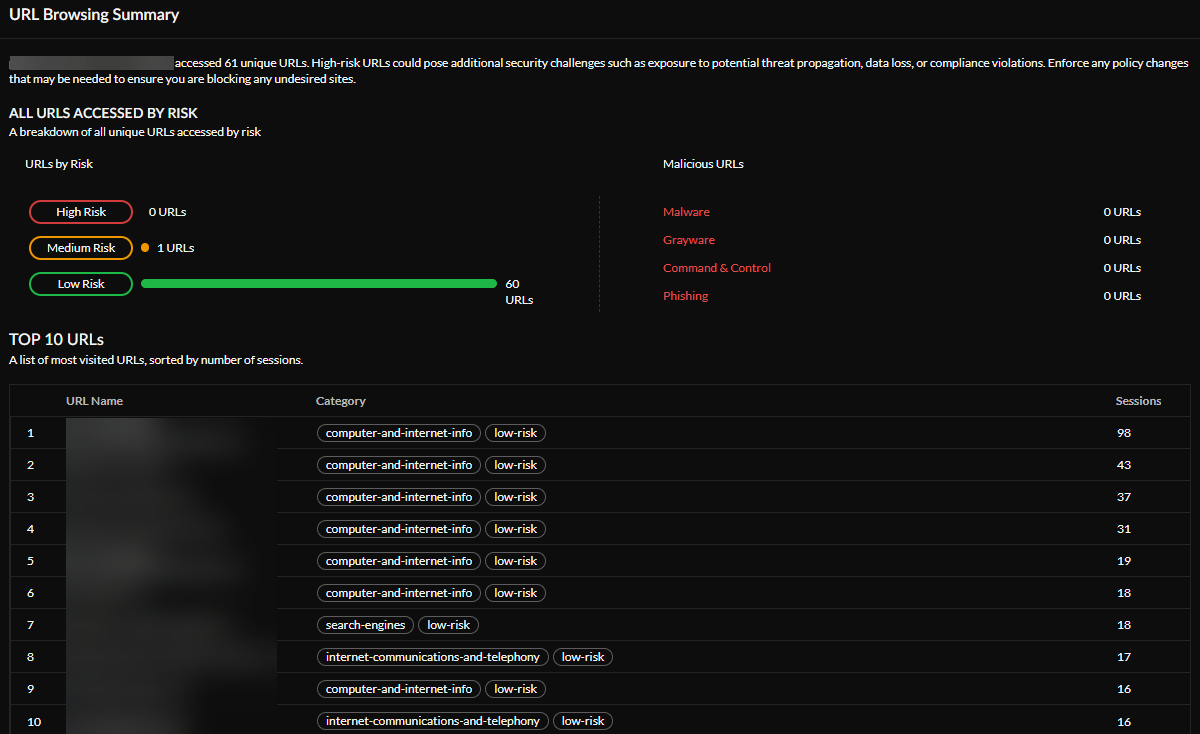
URL Browsing Summary—See your URL browsing summary,
including all URLs that you accessed by risk. You can view a breakdown of URLs
by risk (High, Medium, or Low) and see how many malicious URLs you accessed. You
can also view a list of the Top 10 URLs visited, and how
many times you visited each URL.
View URL Filtering Logs—Select View URL Filtering
Logs to view details about total data transferred. The logs
provide an audit trail for system, configuration, and network events. Network
logs record all events where Prisma Access acts on your network.
- View all log data, or use the drop-down to filter by Firewall/URL, Common, or Endpoint. Each of these filters has several subfilters to choose from, as well.
- Enter a log query. Click in this field to view a selection of queries to start with, and build your query.
- Select a time range. The default is past 60 minutes.
- Select Log Settings to view the Strata Logging Service dashboard. Strata Logging Service manages the delivery mechanism for logs.
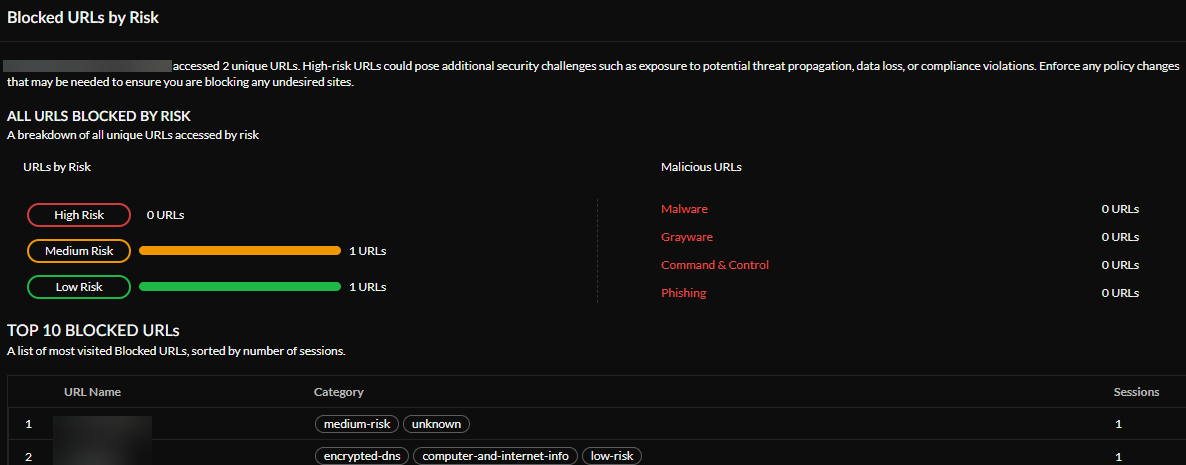
Blocked URLs by Risk—See whether you have accessed, or
tried to access, any URLs blocked by risk. High-risk URLs might create
additional security challenges, such as exposure to potential threat
propagation, data loss, or compliance violations. Enforce any policy changes
necessary to block any undesired sites. You can also see a list of the
Top 10 Blocked URLs that you visited most, sorted by
the number of sessions.
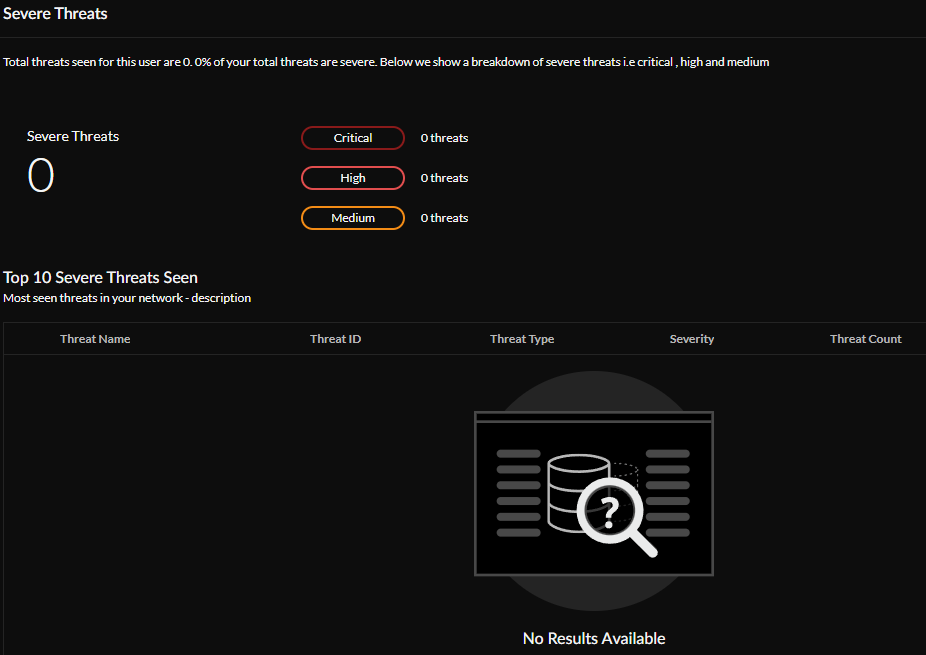
Severe Threats—See how many of your threats are severe.
Severe threats are further broken down into Critical, High, and Medium threats.
You can also view a list of the Top 10 Severe Threats
Seen in your environment.
Connectivity
Select any User name to view information about the user's
Connectivity during the Time
Range selected.
Active Projects—You can see which projects were active during the time
range you selected, and the date that each project became active.
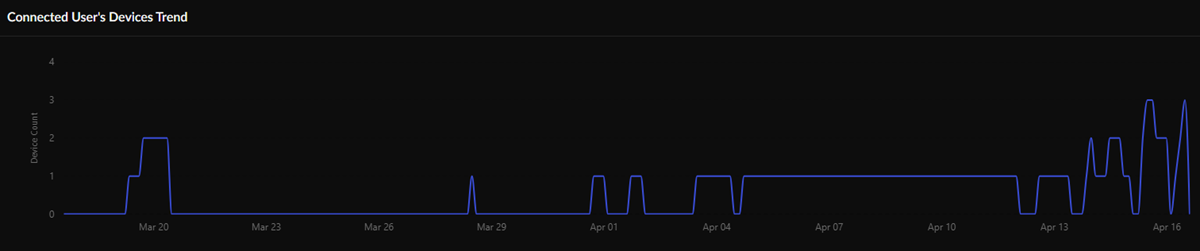
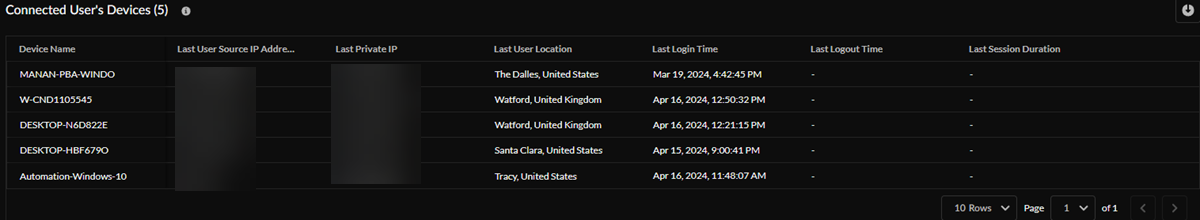
Connected User's Devices Trend and Connected User's Devices—On the main
Users page, you could see all connected users and their projects. On the
Connectivity page, view your individual Connected User's
Devices trend during the time range selected and details about your
Connected User's Devices, such as device name, last user source IP
address, last private IP address, last user location, last login time, last
logout time, and last session duration.
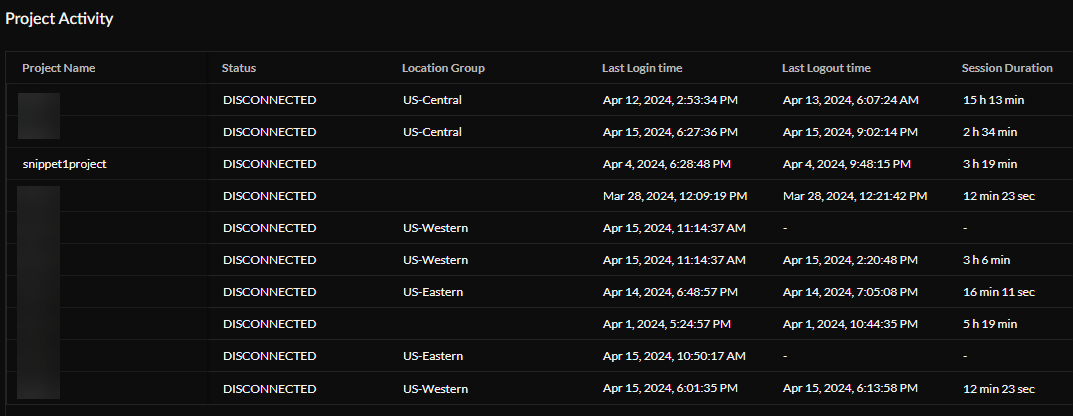
Project Activity—View a user's project activity by session. You can see
the current status of a session, when the user logged into each project, when
they logged out, and how long each session lasted.
Total User Activity by Project—View the time a user spent on each project
during the time range selected.